ToppGene functional enrichment analysis using BIODICA Navigator
Altynbek Zhubanchaliyev, Nicolas Captier
The aim of this tutorial is to show how BIODICA can perform ToppGene functional enrichment analysis on identified stabilized Independent Components (IC’s). We will use 30 IC’s extracted from OVCA-transcriptomic dataset in the ICA decomposition tutorial.
Warning : When running this tutorial, please keep in mind that the ranking of the IC’s will not necessarily be the same as indicated here, since BIODICA uses ICA decomposition algorithm with random initializations. For instance, IC5 we refer to in this tutorial may correspond to an IC with a ranking other than 5 in your case.
Performing ToppGene analysis
-
Open BIODICA and press ‘ToppGene’. Our current directory is BIODICA.

-
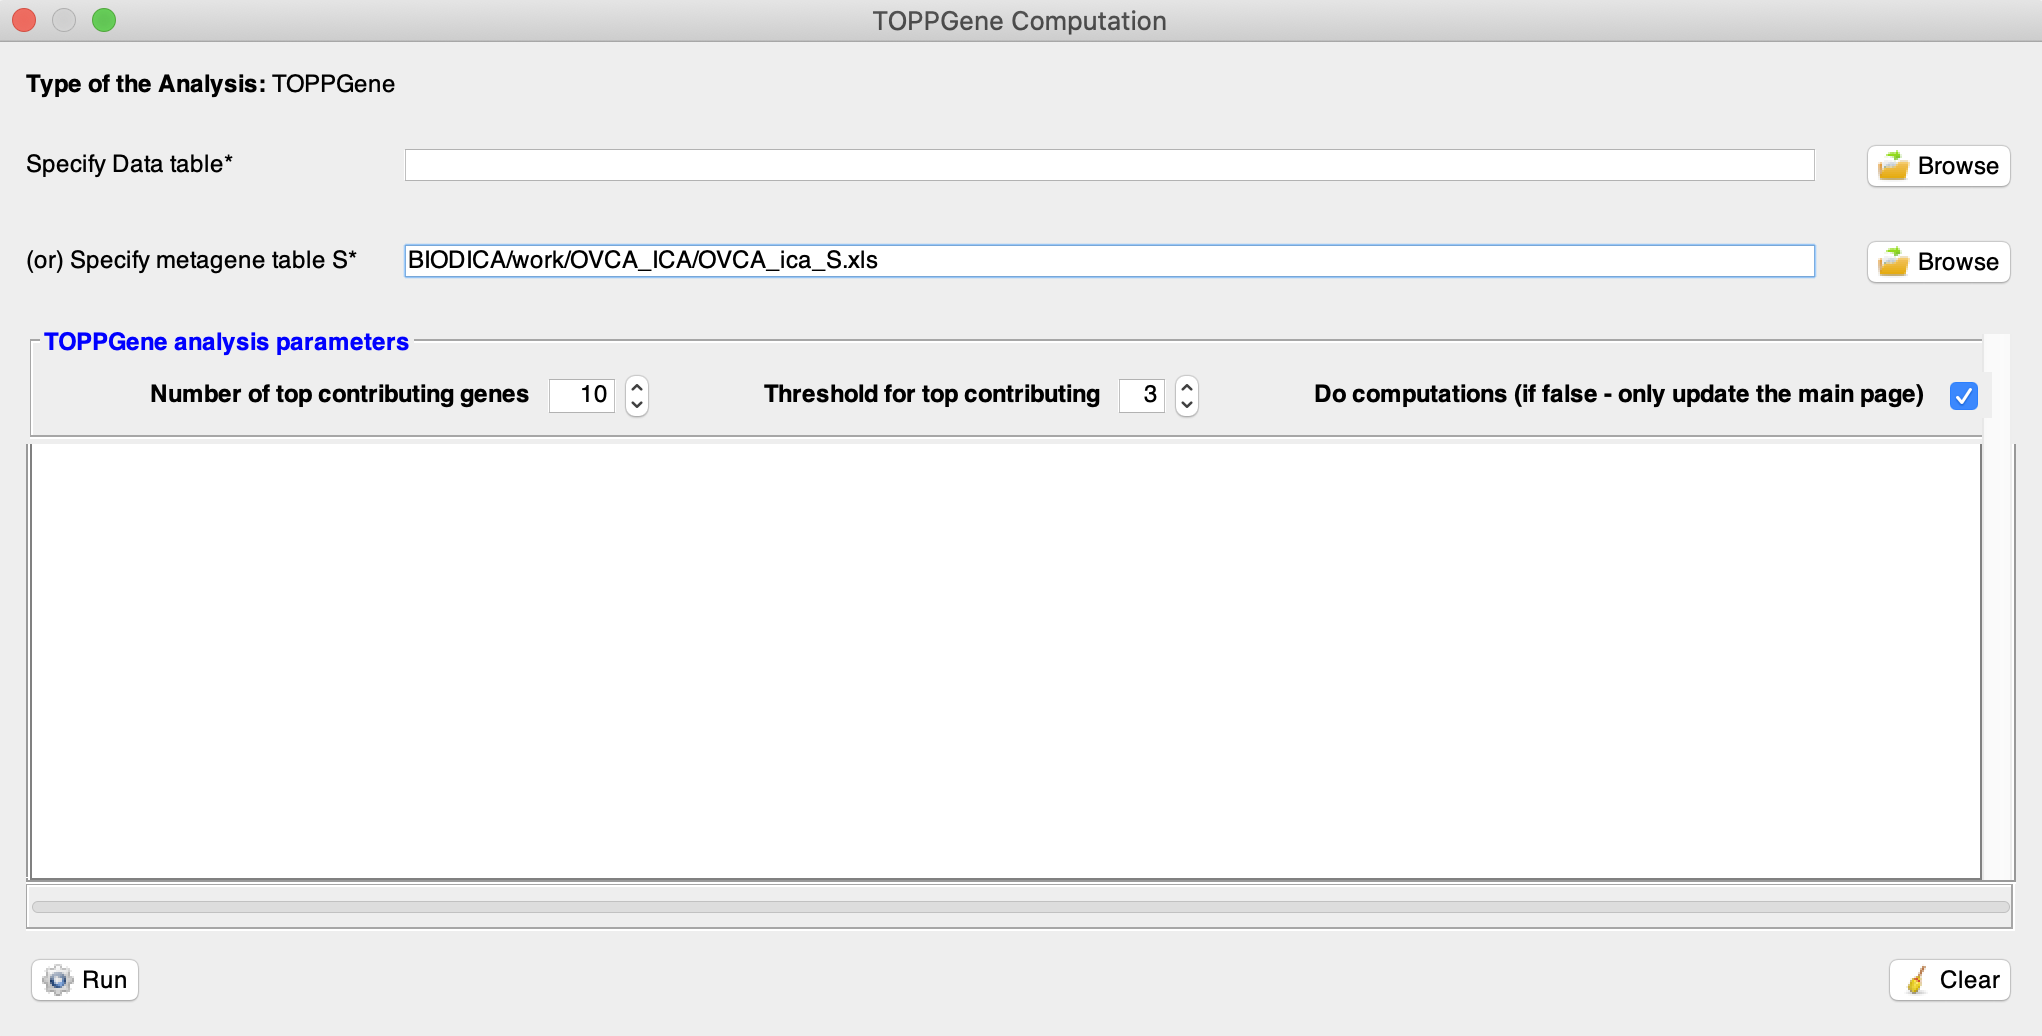
Select a metagene table from previous ICA decomposition by pressing ‘Browse’ in front of Specify metagene table S. Here we will use a decomposition of the OVCA dataset, located in BIODICA/work/OVCA_ICA/OVCA_ica_S.xls.
-
Select a threshold for top contributing genes (using Threshold for top contributing). For each metagene it will only select the genes with weights (in absolute value) above this threshold times the standard deviation of the gene weights for this metagene. By default, the top contributing genes are selected when their associated weight (in absolute value) is higher than 3 times the standard deviation.
-
Hit ‘Run’. You will see that the process has started. It will take time to finish ; around 30 minutes, depending on the machine you are using and the number of components being enriched.


After the process is finished, this window opens up in browser.
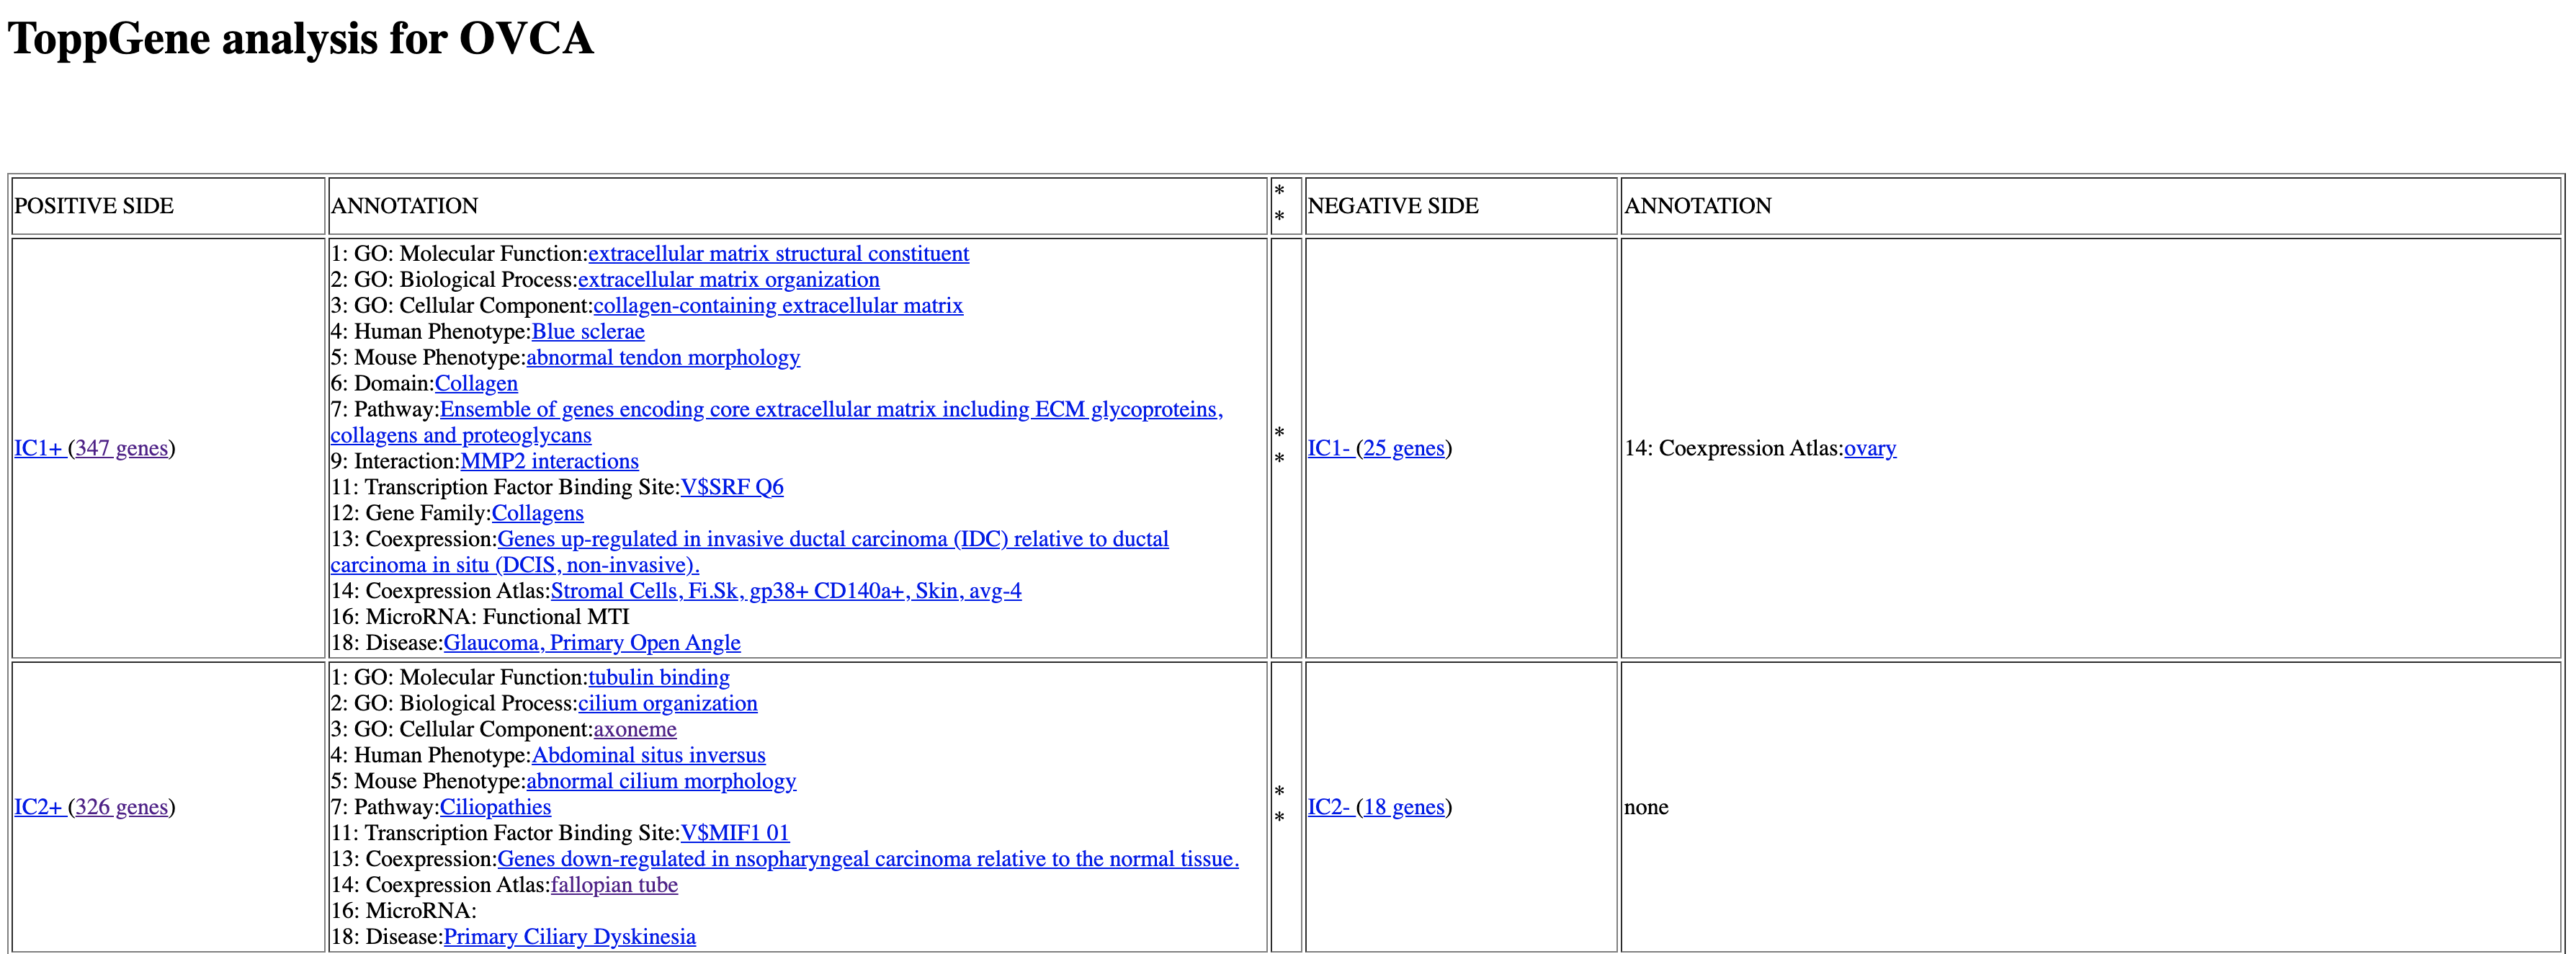
All 30 IC’s from ICA decomposition of OVCA dataset are shown as rows of the table. Each Independent component has a positive side and a negative side, corresponding to the positive and the negative tails of the metagene distribution (i.e the genes with positive weights above threshold x std and the genes with negative weights below -threshold x std). Note that the components are ranked by stability, meaning the most stable ones will appear on top.
Under the column ANNOTATION we can find 18 categories for which the gene list from each IC was enriched. For example, on this picture, the genes from IC1 were enriched for Molecular Function ‘extracellular matrix structural constituent’. However, we need to further check the statistical validity of this enrichment.
For some categories there is no significant enrichments, and these categories will not be shown in the list. Sometimes we can observe no enrichment at all, as in IC2- in our case.
Interpreting the results
Let’s look at the IC5+. Pressing on the number of genes (307 in our case) will give you the list of top contributing genes with a positive weight. You can click on each gene symbol and read a description on genecards.org database.
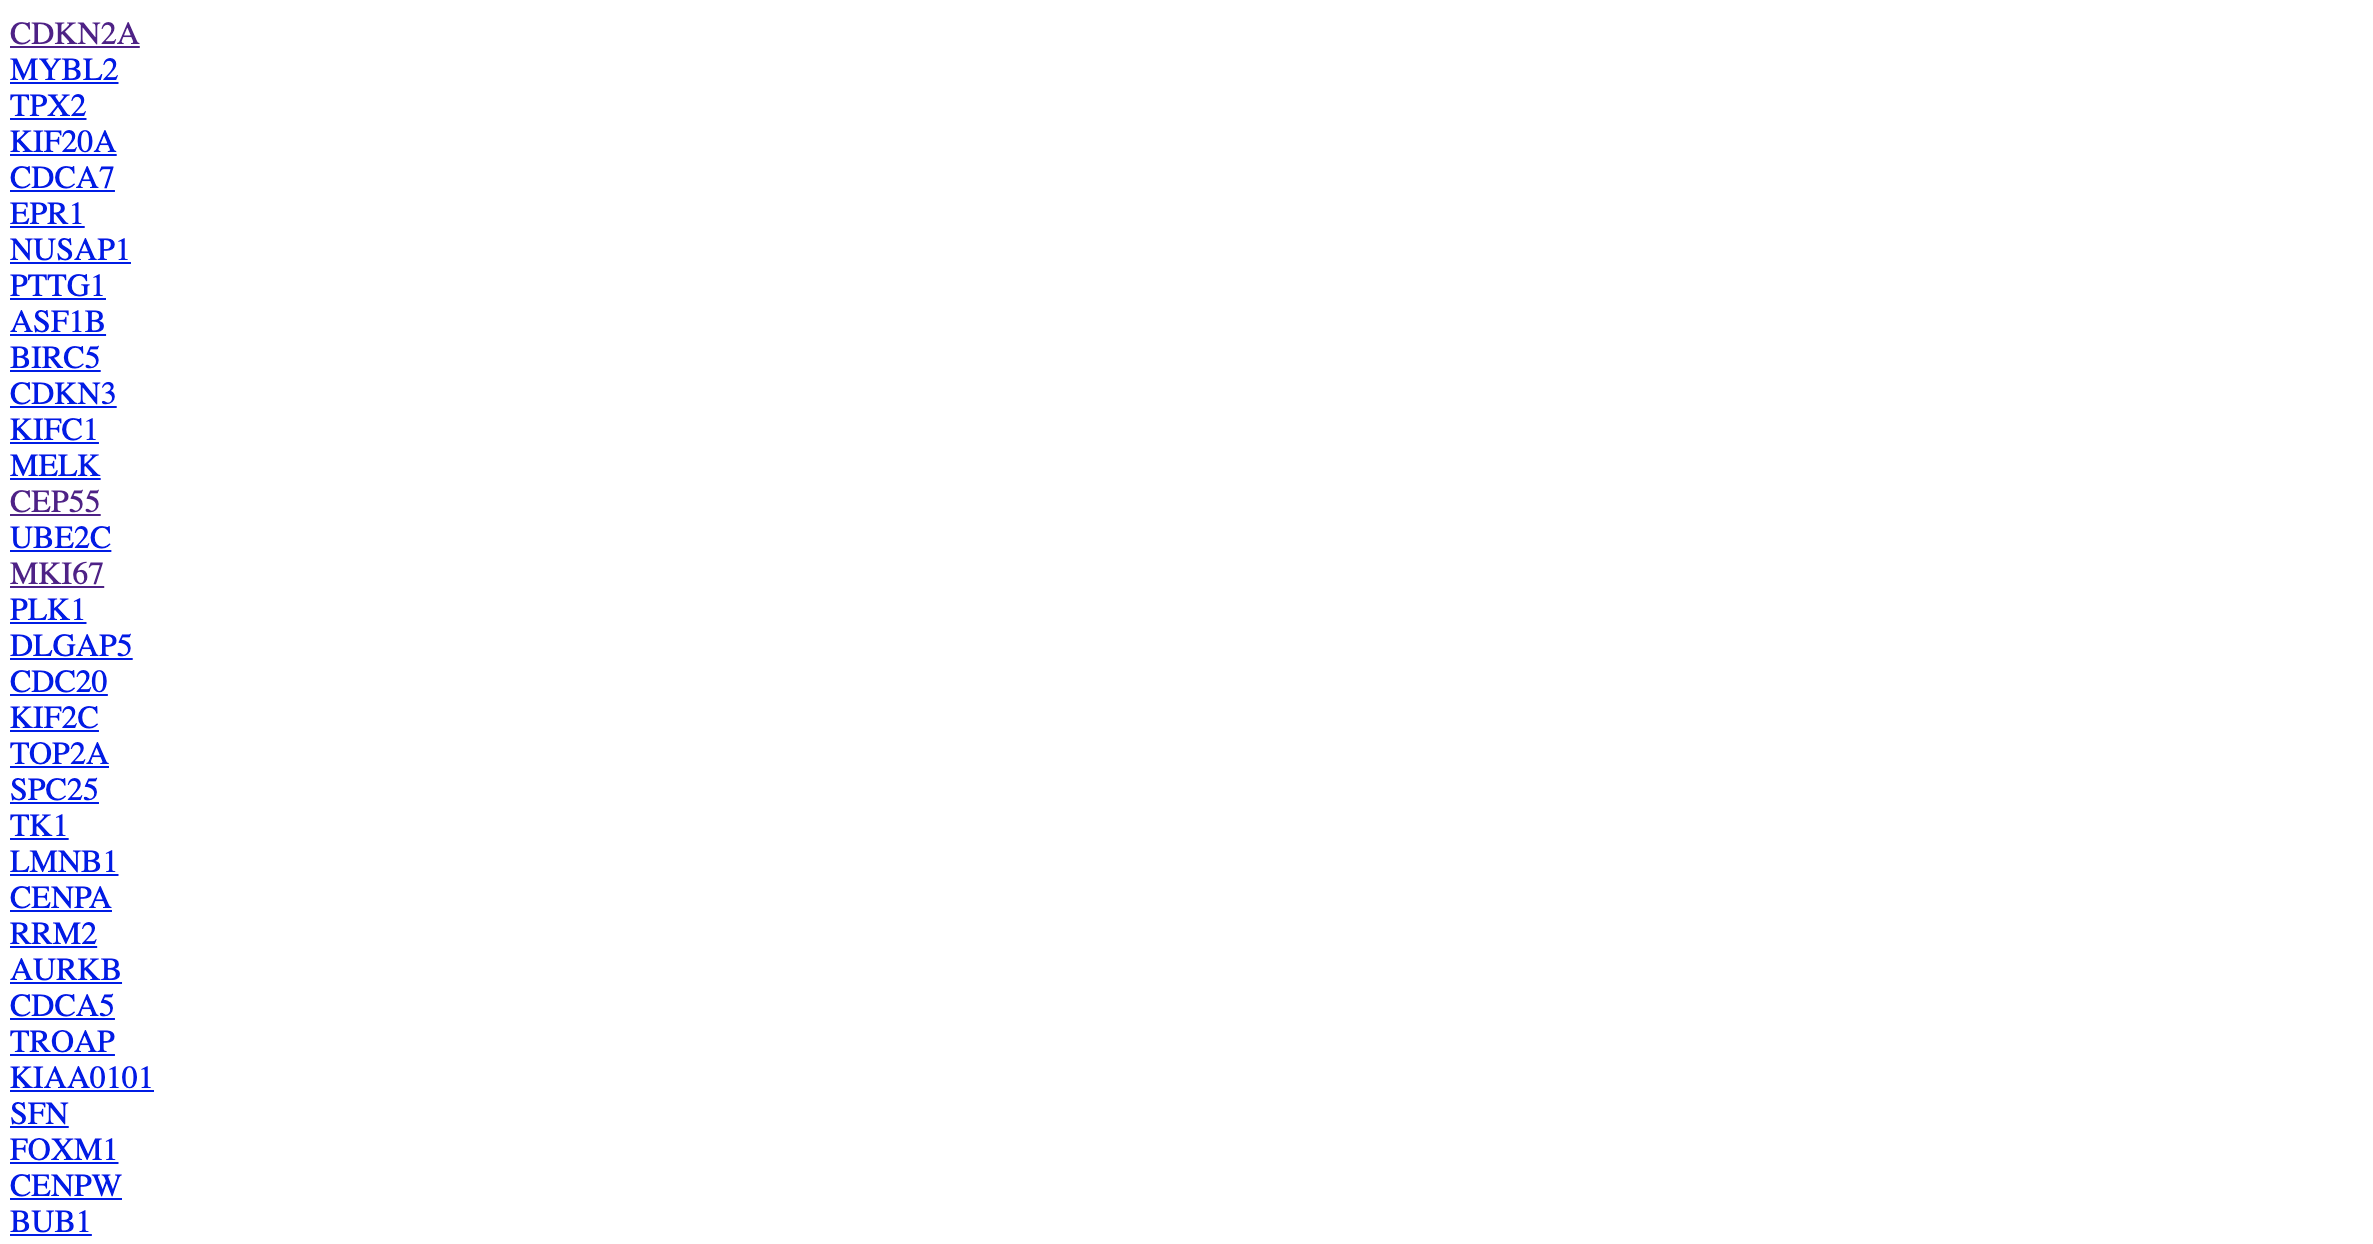
Go back and press on IC5+. You will get the following table.
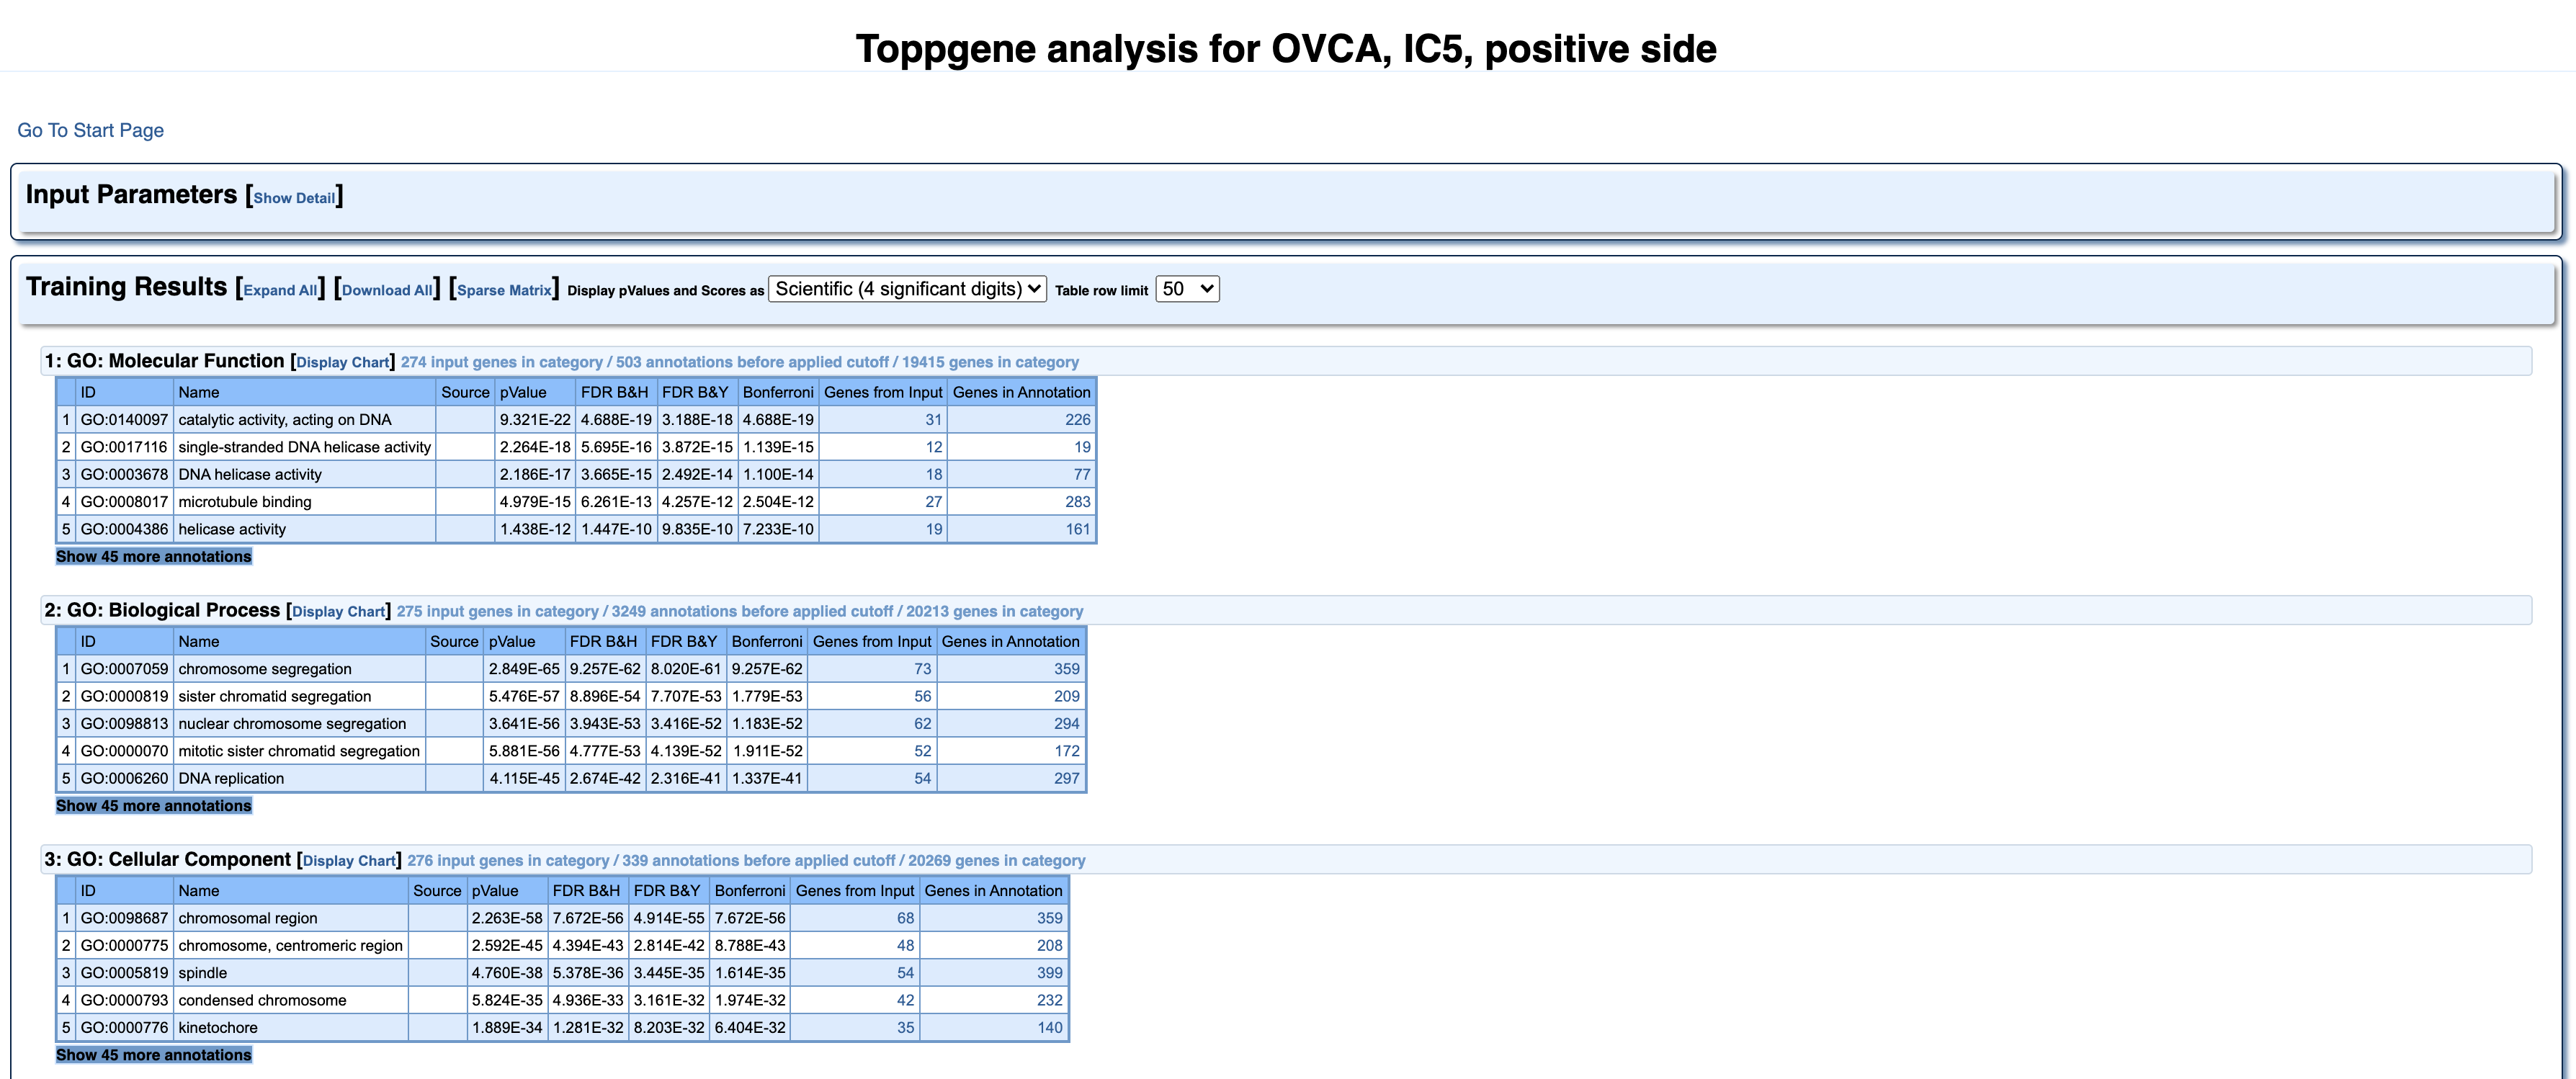
It is identical to the results page from ToppGene website. Here we can find more detailed information about all the 18 categories, for which the 5th independent component was enriched. Every category has a list of elements, which can be expanded, by pressing ‘Show 45 more annotations’.
If we take a closer look at the second category GO: Biological Process, under the Name ‘chromosome segregation’ we can see the number of genes from our IC (73), that were enriched for the genes known to be part of this biological process (359). Bonferroni column here represents multiple testing correction method and 0.05 for significance cut-off level. And in this case the order of magnitude of -62 indicates a very significant enrichment.
You can click on the number, in the column Genes in Annotation to see the list of genes associated with ‘chromosome segregation’.
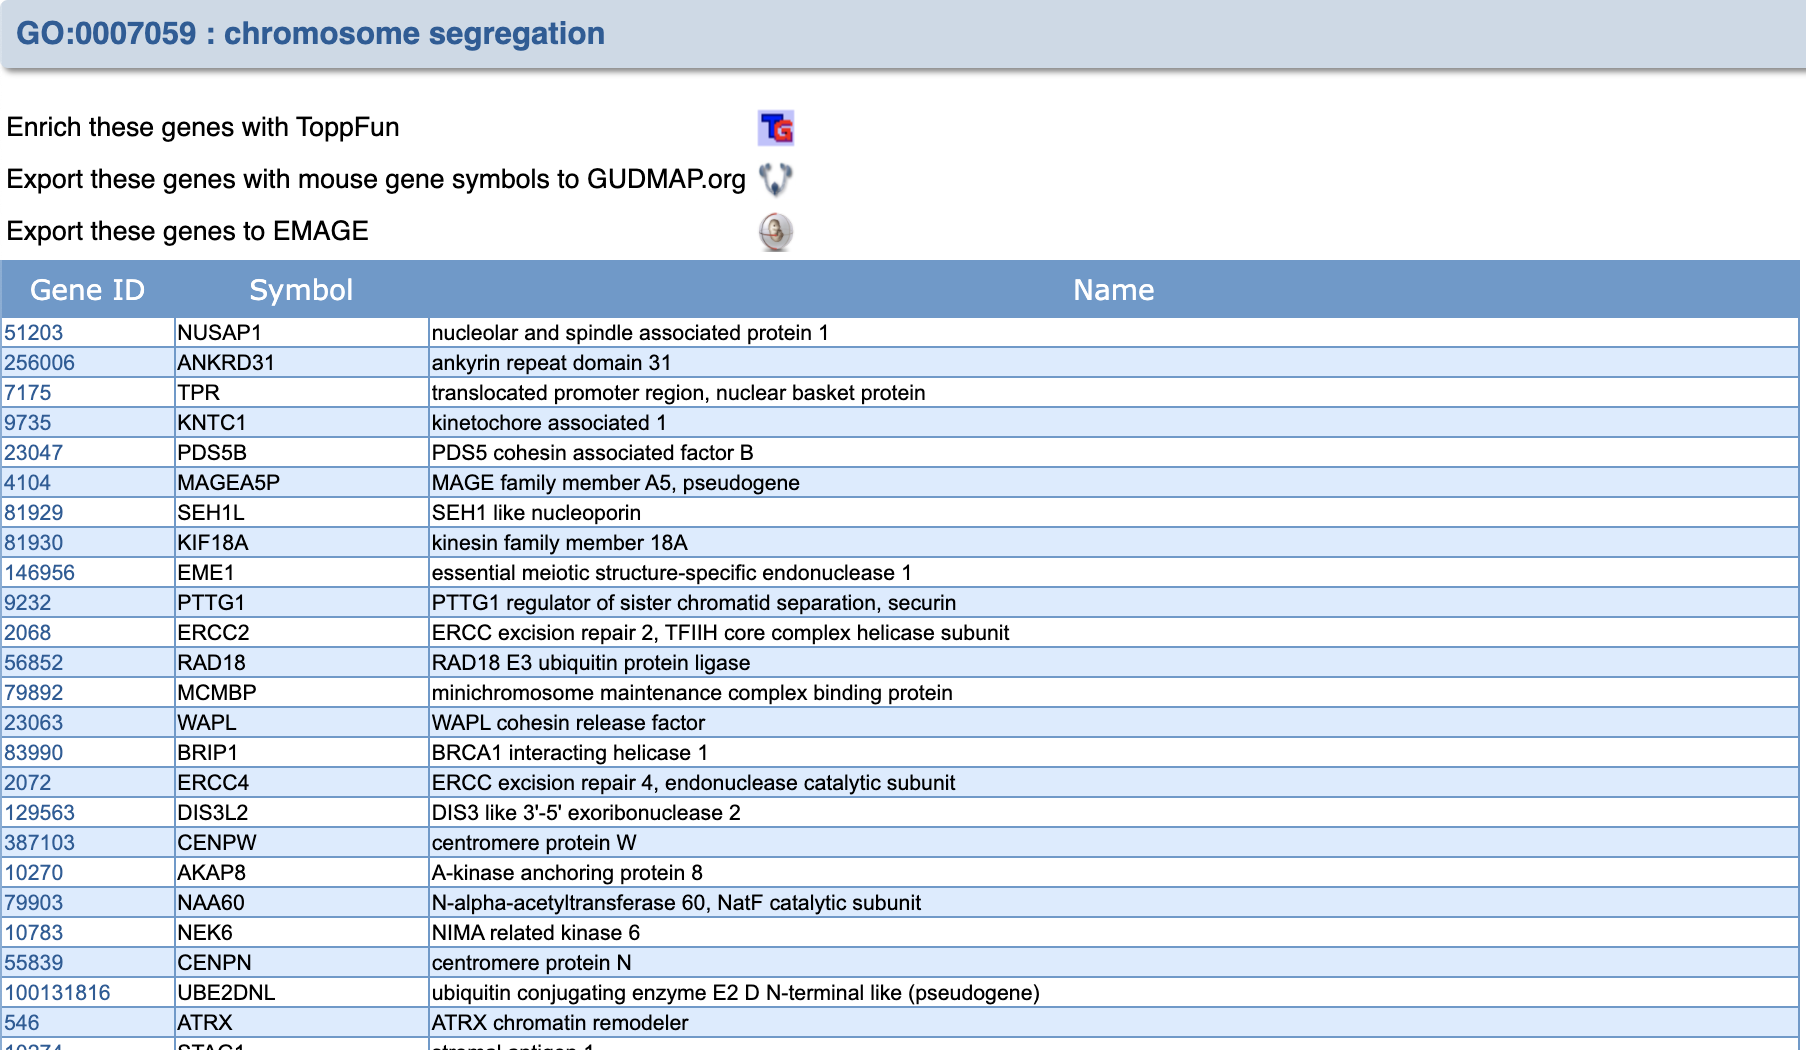
By clicking on the number under Gene ID you can read about each gene.
Additionally, you can access an original Gene Ontology database by entering GO number from ID column into the QuickGO database.

On the main page of ToppGene analysis that BIODICA opens up, you can access the most significant GO: process, cellular component, function etc. by directly clicking on it.
Pathway
Let’s go back to the IC5+ ToppGene page. Find Pathway category.

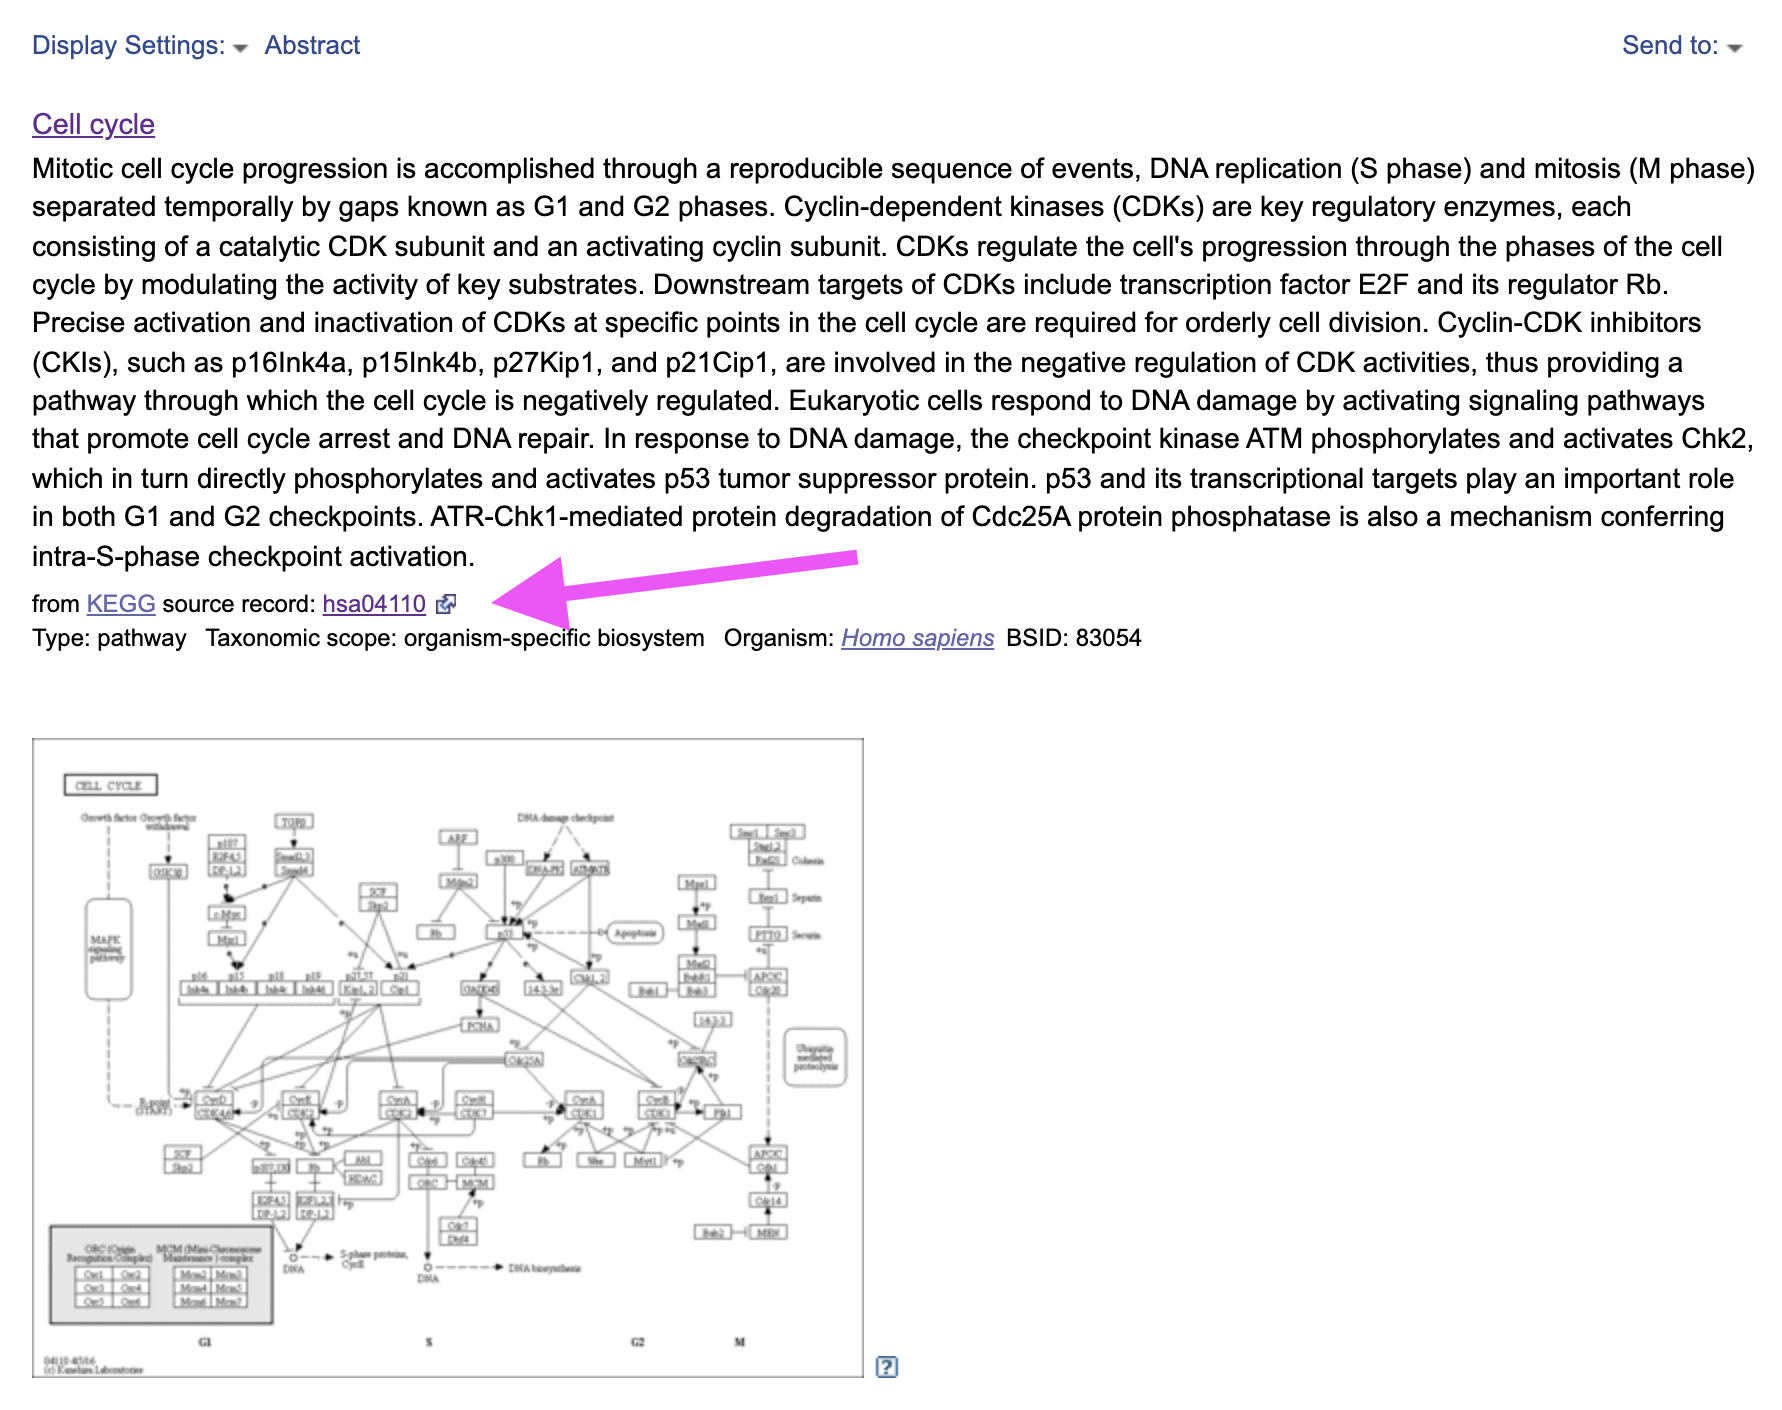
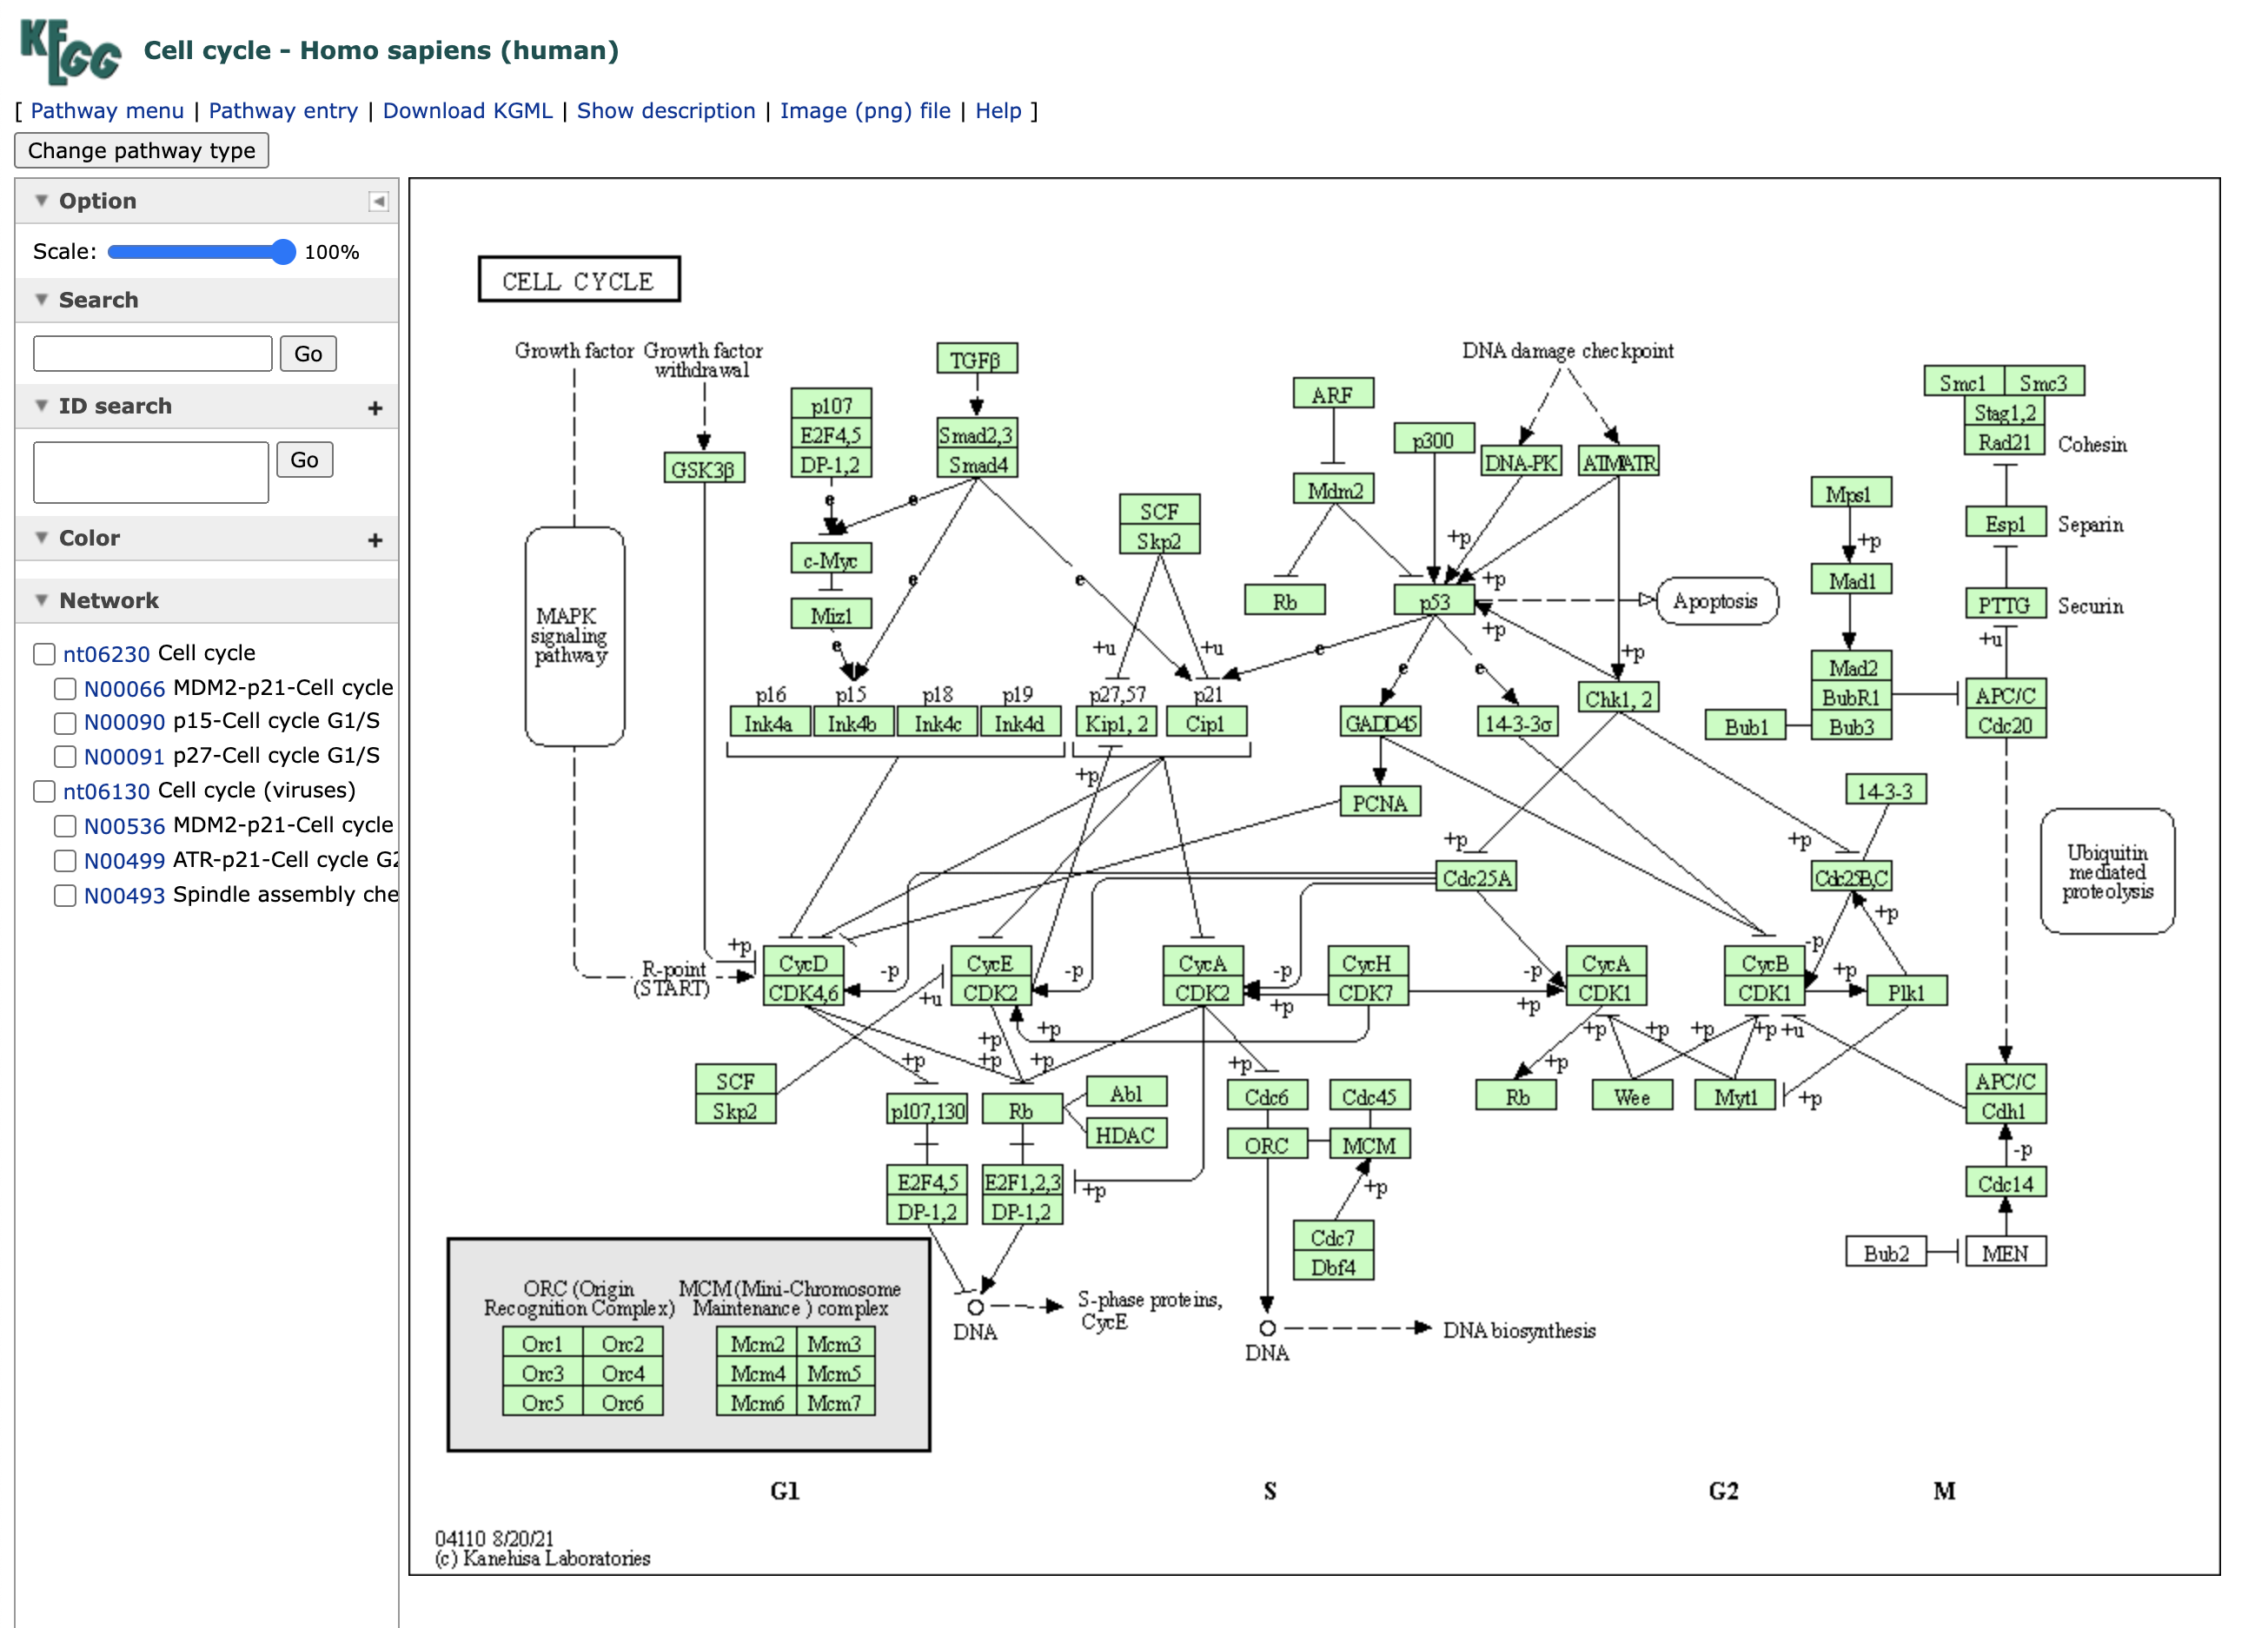
According to KEGG database (Source column) our component is significantly enriched for Cell cycle pathway. This is also true according to BIOCARTA. Click on KEGG and it will bring us to the NCBI database page of the Cell cycle pathway description. By clicking on source record, indicated by the magenta arrow we can go to the original KEGG pathway profile.
