Gene Set Enrichment Analysis using BIODICA
Altynbek Zhubanchaliyev, Nicolas Captier
The aim of this tutorial is to show how to perform Gene Set Enrichment Analysis (GSEA) using BIODICA. We will use 30 IC’s extracted from OVCA-transcriptomic dataset in the ICA decomposition tutorial.
Warning : When running this tutorial, please keep in mind that the ranking of the IC’s will not necessarily be the same as indicated here, since BIODICA uses ICA decomposition algorithm with random initializations. For instance, IC5 we refer to in this tutorial may correspond to an IC with a ranking other than 5 in your case.
Performing GSEA analysis
-
Open BIODICA and press ‘GSEA’. Our current directory is BIODICA.

-
In the GSEA Computation window, select a metagene table from previous ICA decomposition of OVCA dataset by pressing ‘Browse’ in front of Specify metagene table S. Here we will use a decomposition of the OVCA dataset, located in BIODICA/work/OVCA_ICA/OVCA_ica_S.xls.

Note: Alternatively you could use your own list of differentially expressed genes by ‘Specifying Data table’.
-
Set the parameters values for GSEA computation. In this tutorial we will set the threshold for top contributing genes to 3 standard deviations and the ‘Number of GSEA permutations’ to 100. The rest of the parameters can stay default for this tutorial.
-
Press ‘Run’.
Interpreting the GSEA results
Given a pre-defined set of genes (e.g. genes participating in one metabolic pathway, or sharing the same gene ontology), we aim to find out if the members of the set are upregulated in our study, down-regulated, or randomly distributed thus obtaining no significant enrichment.
The following screenshot shows how GSEA results table looks like. All the results are saved in (BIODICA/work/OVCA_GSEA) directory. The results are filtered for those enrichments which have at least k top contributing genes in the leading edge set and which p-value, corrected for multiple testing, is less than the ‘adjusted p-value threshold’ (in our tutorial k=5 and p_value threshold = 0.01).

30 OVCA_IC’s are placed as rows, and indicated in red. For each component there is number of gene sets and a corresponding statistical significance of the Enrichment Score (ES) for each gene set, i.e. a p-value of enrichment.
For example, in the first row on the figure above, the number ‘7’ next to OVCA_IC18 corresponds to the number of gene sets which received a significant enrichment. Going further, 8 out of the 200 members of the enriched gene set ‘HALLMARK_TNFA_SIGNALING_VIA_NFKB’ belong to the top-contributing genes of IC5. Besides, this gene set is associated with a Family-wise error rate (FWER) below 0.01, which means that the estimated probability that the normalized enrichment score associated to ‘HALLMARK_TNFA_SIGNALING_VIA_NFKB’ represents a false positive finding is less than 1%.
Pressing on freqgenes
It shows the list of top contributing genes of the component IC5. Besides, for each one of these top contributing gene, it shows the number of significantly enriched gene sets that contain it.

Pressing on each of the gene set
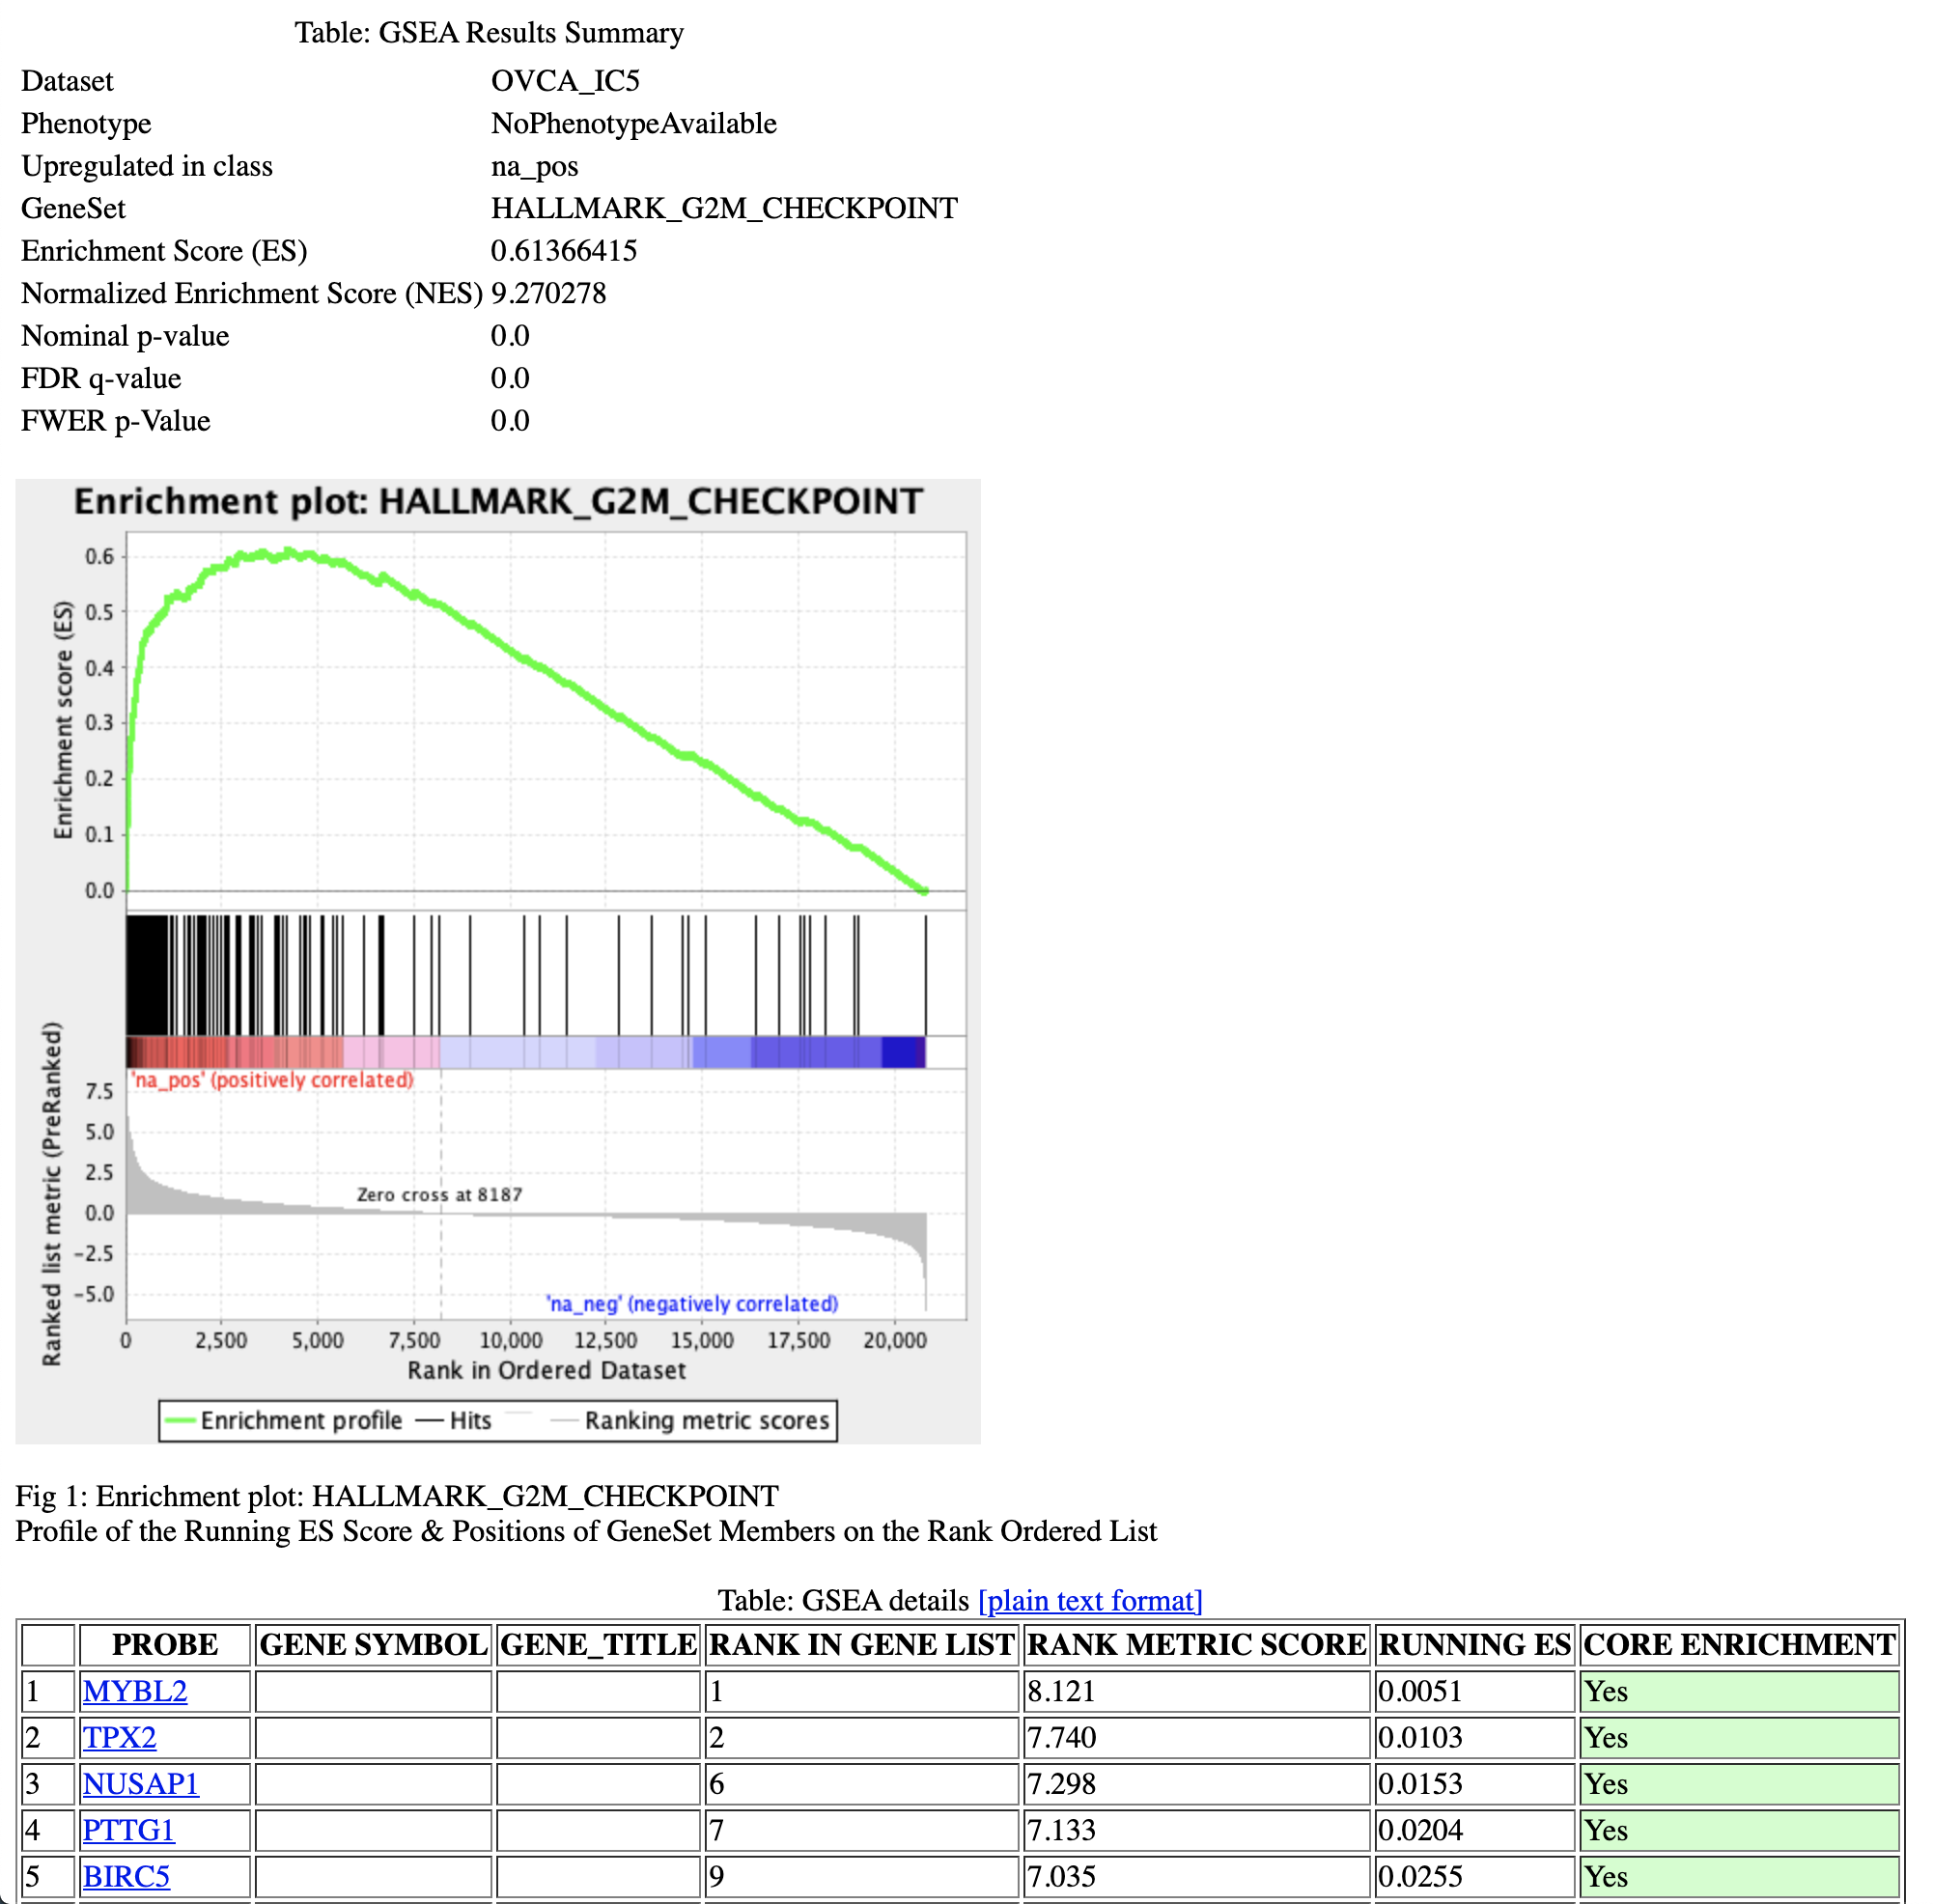
Let’s have a look at IC5, which we studied in the ToppGene tutorial. Clicking on ‘HALLMARK_G2M_CHECKPOINT’ gene set will give the following picture.

Here, the enrichment plot provides a graphical view of the enrichment score for the ‘HALLMARK_G2M_CHECKPOINT’ gene set. It shows that a significant number of genes involved in the G2/M checkpoint corresponds to top-ranked genes of the metagene IC5.
Besides, the GSEA details table shows each gene of the gene set, its rank in the IC5 metagene, its associated enrichment score, and whether it belongs to the core enrichment (i.e members of the gene set that appear in the ranked list prior to the peak score (positive enrichment) or subsequent to the peak score (negative enrichment)).
Note: For more detailed information about metrics and how GSEA is performed you can visit the official User Guide.