ICA decomposition using BIODICA Navigator
Altynbek Zhubanchaliyev, Nicolas Captier
After ICA decomposition, each metagene could be associated to a subnetwork in a global network of pairwise interactions such as protein-protein interactions (PPI). This tutorial aims to demonstrate how BIODICA can perform OFTEN analysis (Kairov et al. 2012) - “a method for selecting a number of genes in a ranked gene list such that this set forms the Optimally Functionally Enriched Network (OFTEN), formed by known physical interactions between genes or their products”.
Warning : When running this tutorial, please keep in mind that the ranking of the IC’s will not necessarily be the same as indicated here, since BIODICA uses ICA decomposition algorithm with random initializations. For instance, IC5 we refer to in this tutorial may correspond to an IC with a ranking other than 5 in your case.
Launching OFTEN analysis
OFTEN analysis applied to an IC metagene consists in several steps: 1) For the k top weighted/top ranked genes in the metagene, it maps them on the interaction graph and measure the size C(k’) of the largest component of the subnetwork formed by the k’ genes among the k top genes found in the interaction graph; 2) k’ genes are then randomly sampled and the size of the largest component of the subnetwork they form is measured R(k’) - this step is repeated NumberOfPerms times; 3) Finally a percolation score is computed S(k) = (1/k’)*(C(k’) - Mean(R(k’))) to assess whether the largest component of the subnetwork formed by the top ranked genes of the metagene is highly non-random or not.
These 3 steps are repeated for a number of top ranked genes k going from Min to Max with a step of size Step. At the end, the largest number k_opt after which the percolation score goes down is selected and the largest component of the connected subnetwork is associated to the IC metagene.
-
Open OFTEN analysis tool in BIODICA

-
In the OFTEN window:
-
Select a metagene table from previous ICA decomposition by pressing ‘Browse’ in front of Specify metagene table S. Here we will use decomposition of OVCA dataset from previous tutorials, located in BIODICA/work/OVCA_ICA/OVCA_ica_S.xls.
-
Specify PPI network with the following path BIODICA/knowledge/networks/undirected/hprd9_pc_clicks.xgmml

Parameters of OFTEN are:
- Min - minimal number of top genes in the ranking selected for testing (50 is the default value)
- Step - step with which the scanning is performed (100 is the default value)
- Max - maximal number of top genes in the ranking selected for testing (600 is the default value)
- NumberOfPerms - number of random network samples constructed in order to estimate a statistical significance of the OFTEN score (100 is the default value)
-
-
Press ‘Run’ and ‘OK’ when the process is successfully done. The following window will open up in your browser.
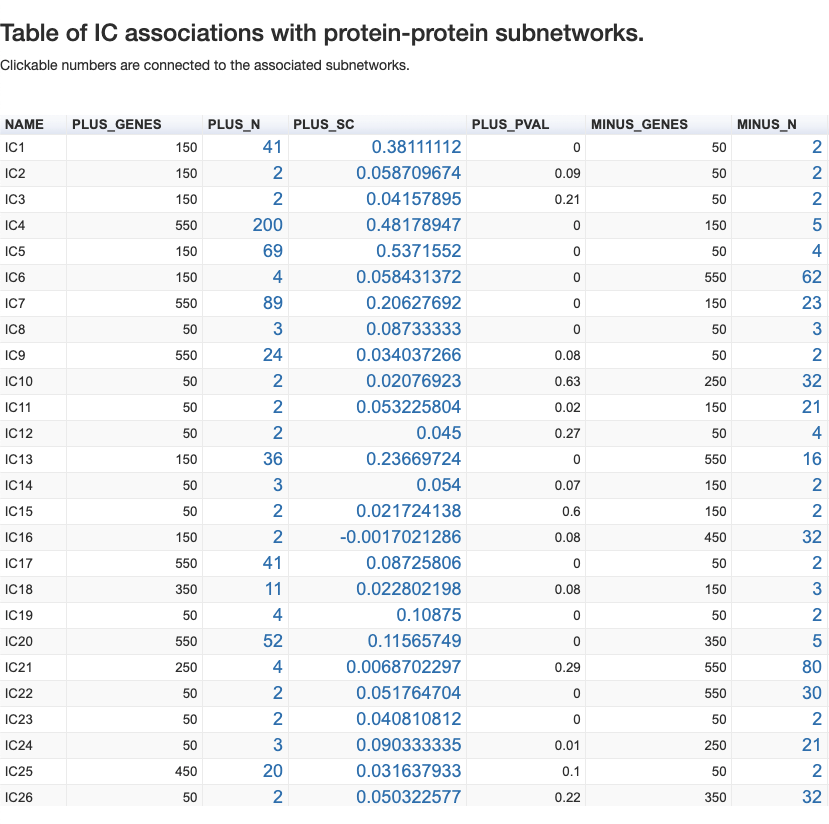
The analysis is done for 3 possible rankings defined by the component: from the positive side (PLUS), from the negative side (MINUS) and from the absolute values of gene contributions (ABS).
For each side, we have the following categories:
- _GENES - number of genes found in the interaction graph
- _N - optimal number of genes forming the network
- _SC - percolation score
- _PVAL - p-value of the association of genes to a subnetwork of PPI
If we scroll down, there will be a list of available files to download.
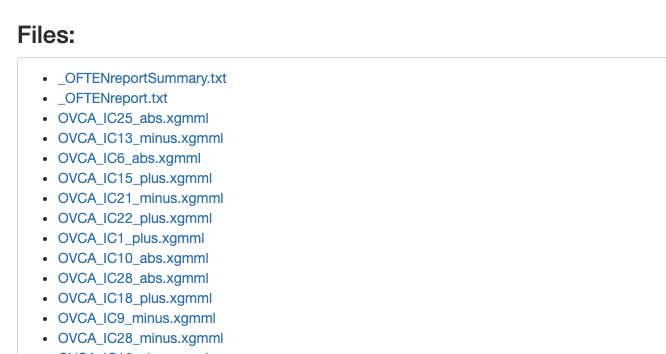
All the files from OFTEN analysis can be found in the newly created BIODICA/work/OVCA_OFTEN folder.
Interpreting the results
The network
By clicking on the number in the column _N, we can look at the constructed optimally functionally enriched network associated to an IC component.
For this tutorial we will focus on the network constructed for IC5 of OVCA_dataset. There are 69 genes at the PLUS_N and p-value = 0. The network looks like this:
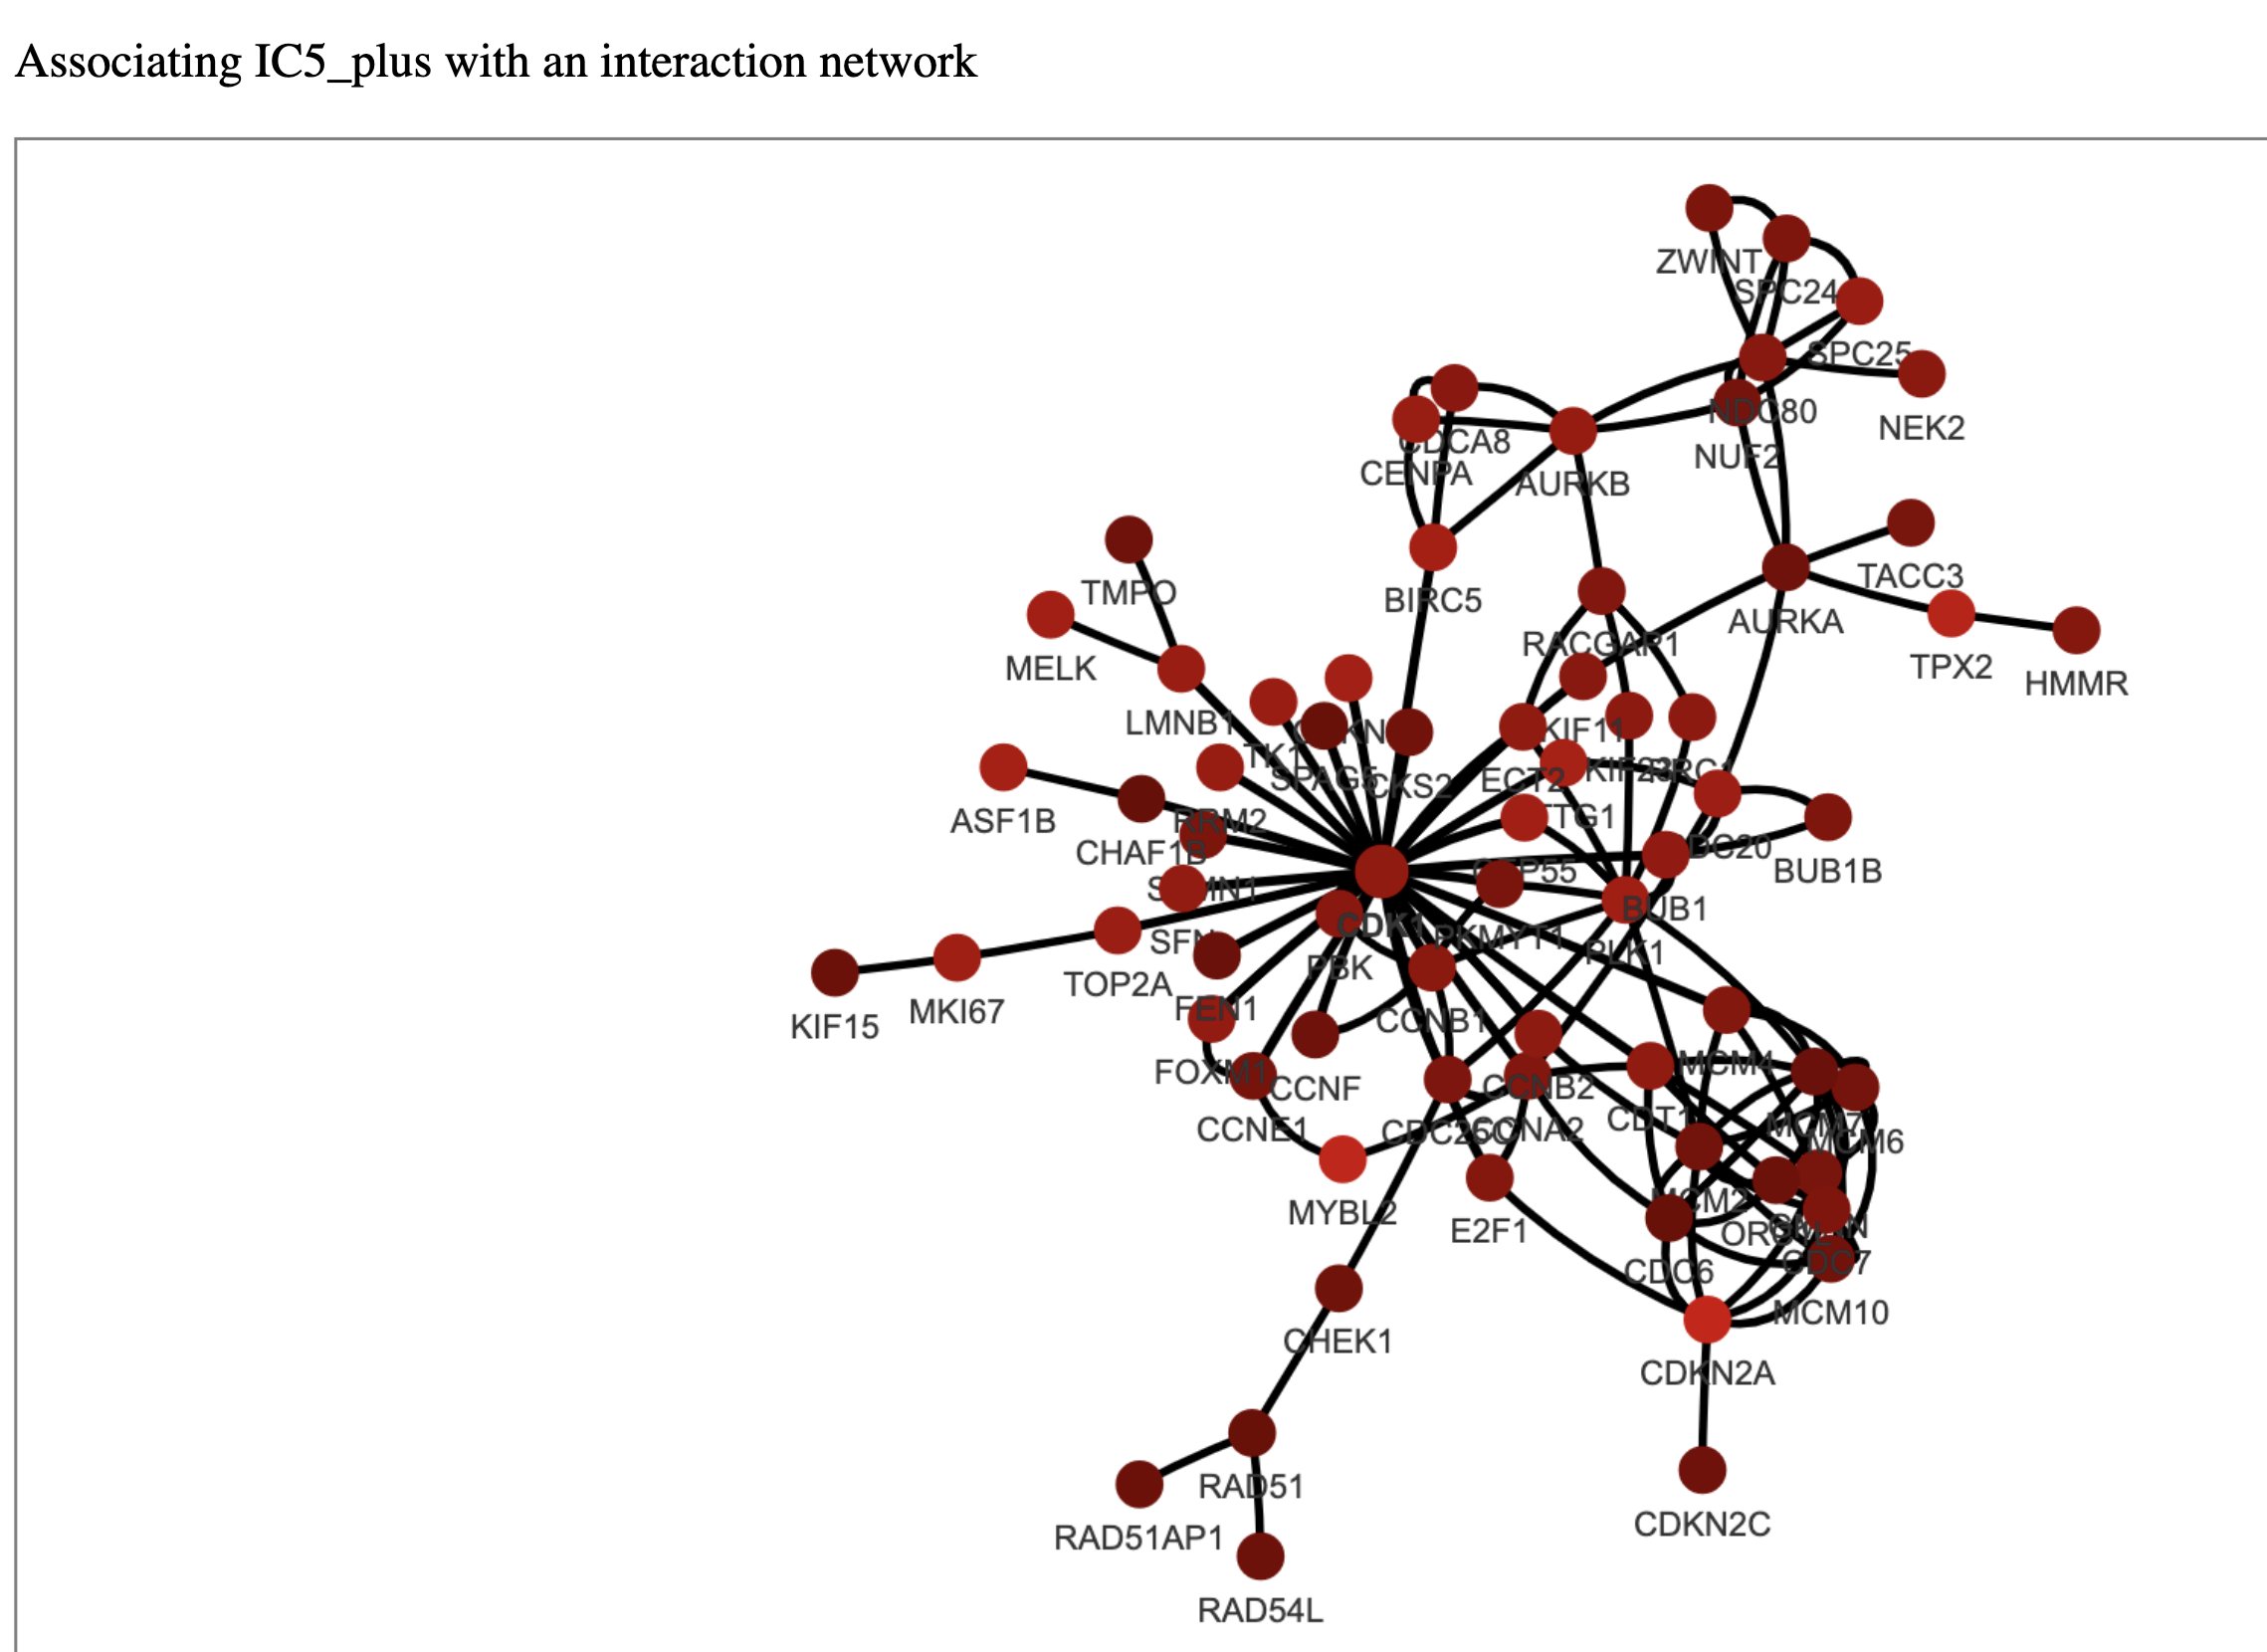
The brighter a node is, the larger its weight in the metagene (i.e its contribution to the metagene) is.
The graph looks slightly crowded, with CDK1 in the center. Additionally we can see genes as MYBL2, E2F1, CCNB1, AURKA and others, which are involved in the cell cycle, either directly controlling it or playing a crucial role in associated processes. In previous tutorials, using metagene annotation tools, we have identified, that genes from our IC5 component are associated with the process of cell cycle. Using OFTEN we can observe meaningful interactions among these genes. This network is interactive and the user can pull the nodes and zoom-in to take a closer look.
The score
By clicking on the number in the column PLUS_SC for the IC5 we will find the following figure, representing the percolation score for the number of genes inside IC5.

Note : The networks are stored as .xgmml files and can be opened with appropriate softwares (e.g. Cytoscape).
Displaying different types of interactions with Cytoscape
When you open the .xgmml file in Cytoscape, there is an option to highlight different types of PPI interactions. By changing the ‘Line Type’ parameter in the ‘Style’ window, which defines the appearance of edges, and assigning it to the ‘interaction’ column, we can display different types of PPI interactions.
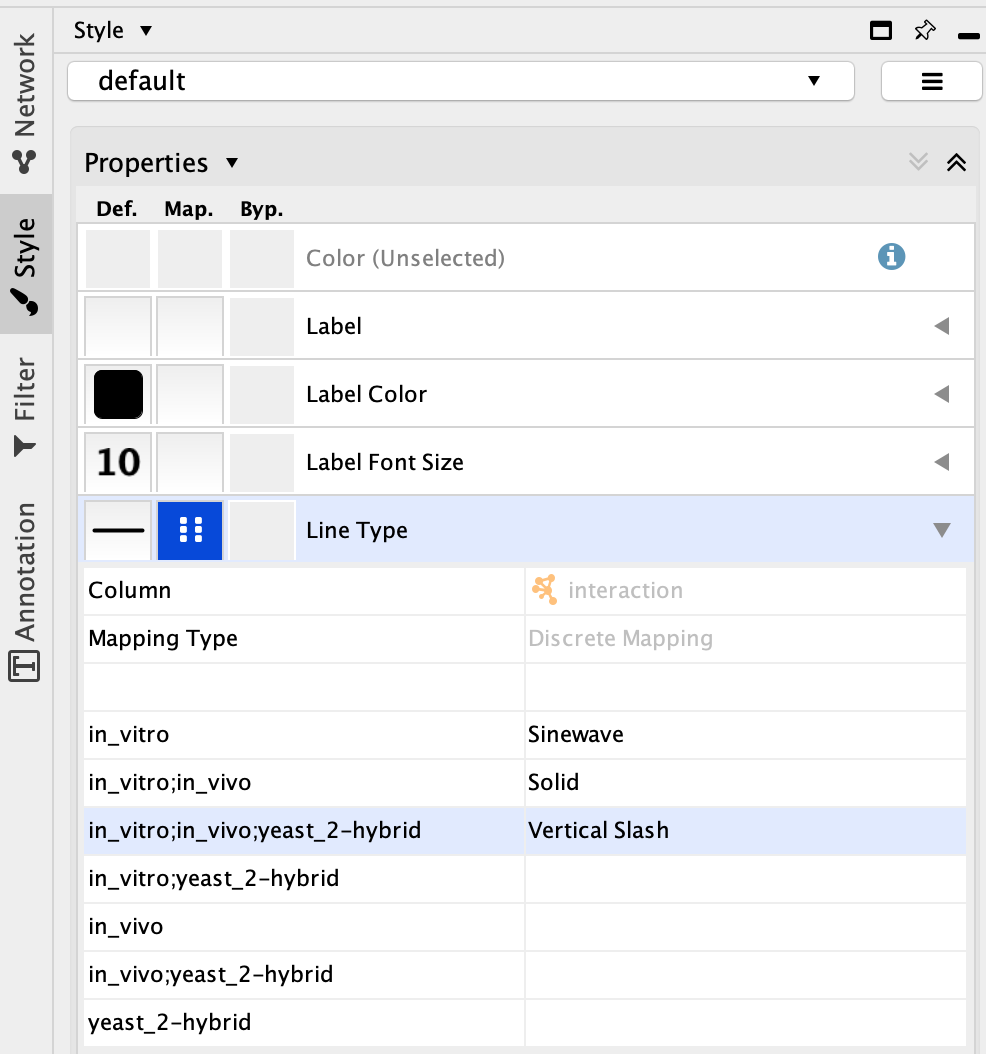
For instance, ‘in_vitro;in_vivo;yeast_2-hybrid’ corresponds to high-confidence interactions since the proteins of interest were found to interact in vivo, in vitro and in yeast two-hybrid molecular screenings. On the contrary, ‘yeast_2-hybrid’ corresponds to low-confidence interations. Highlighting these different types of interactions may be important to thoroughly analyse the OFTEN network.
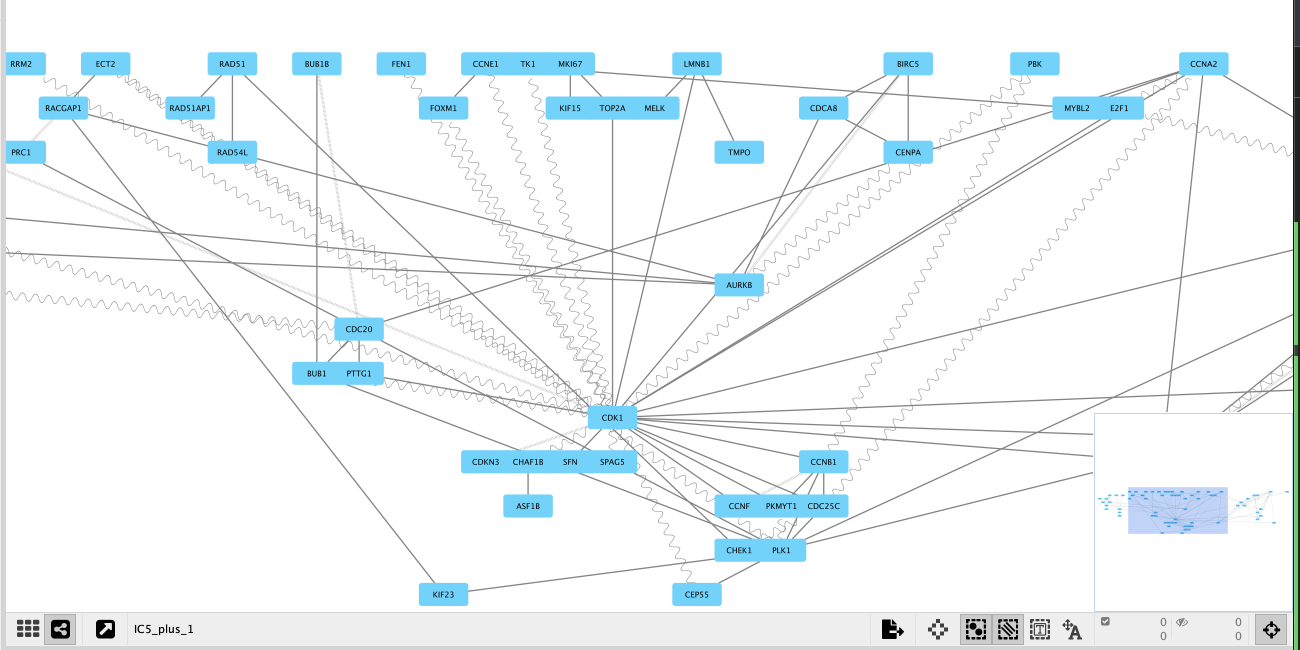
This is how our IC5_plus OFTEN network with modified representation of edges looks like. We chose to represent ‘in_vitro;in_vivo;yeast_2-hybrid’ interactions with vertical slashes, ‘yeast_2-hybrid’ interactions with sine waves, and ‘in_vitro;in_vivo’ interactions with solide lines.
