Visualization of independent components with NaviCell
Altynbek Zhubanchaliyev, Nicolas Captier
NaviCell platform provides an easy molecular maps navigation and exploration tool. It includes a powerful module for visualizations of different types of “omics” data on the NaviCell maps. This tutorial aims to demonstrate how BIODICA can be used to visualize independent components on NaviCell molecular maps.
Warning : When running this tutorial, please keep in mind that the ranking of the IC’s will not necessarily be the same as indicated here, since BIODICA uses ICA decomposition algorithm with random initializations. For instance, IC5 we refer to in this tutorial may correspond to an IC with a ranking other than 5 in your case.
Launching NaviCell
-
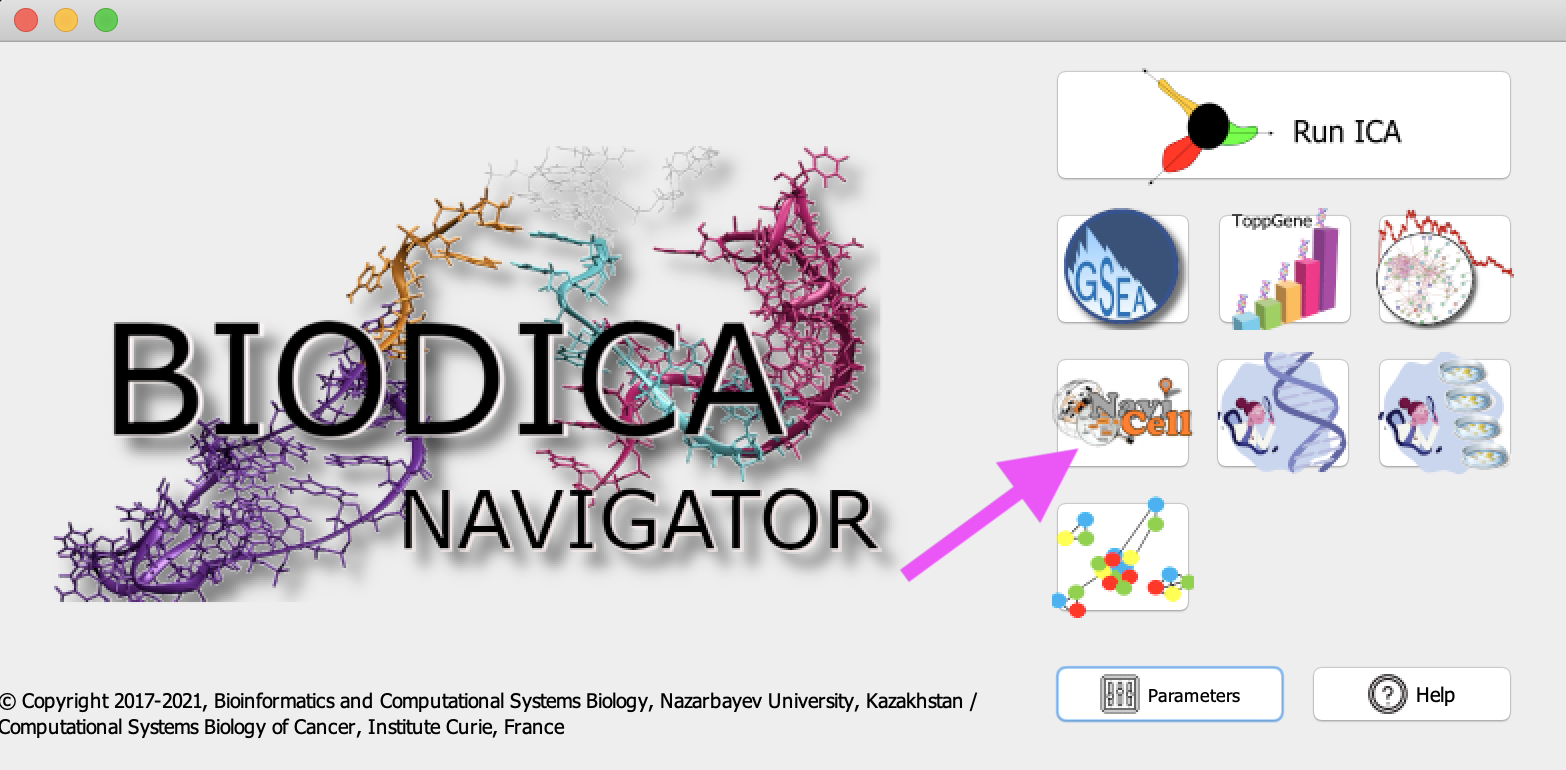
Open the NaviCell visualization tool in BIODICA
-
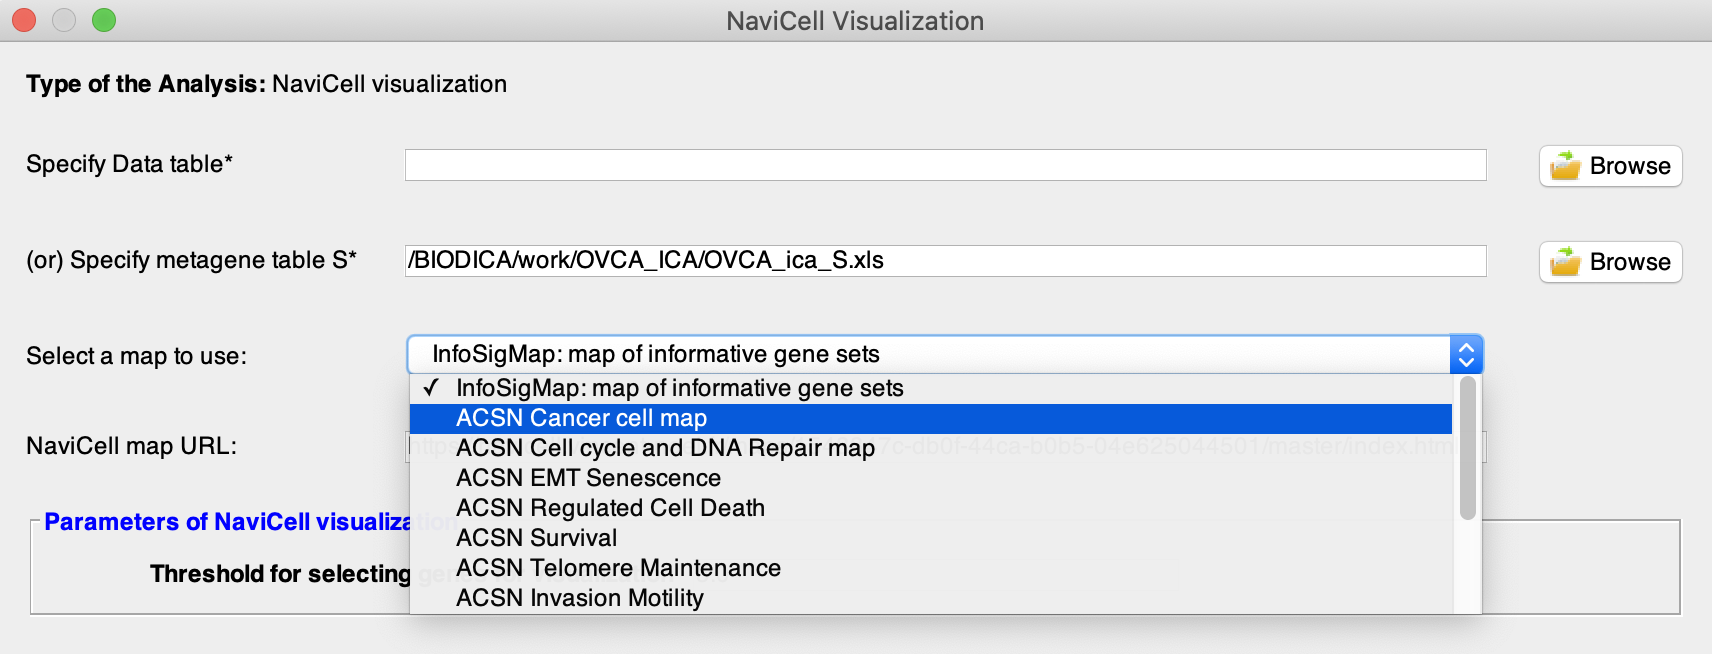
In the NaviCell window specify the metagene file, obtained from previous ICA decomposition. For this tutorial we will use an ICA decomposition of OVCA_TCGA dataset, performed in previous tutorials. It is located at /BIODICA/work/OVCA_ICA/OVCA_ica_S.xls
-
By pressing on the field ‘Select a map to use’ you can choose a map to visualize your metagenes on. NaviCell map URL parameter changes according to this choice. Here we will choose ACSN cancer cell map.
-
Set the number of standard deviations used for selecting the top-contributing genes of each independent components. By default, this parameter is set to 5 standard deviations.

-
Press ‘Run’ and click ‘OK’ when the process is finished. The web-browser tab will open.
Map navigation
You will find the following window. NaviCell uses the same principle of navigation as Google maps.
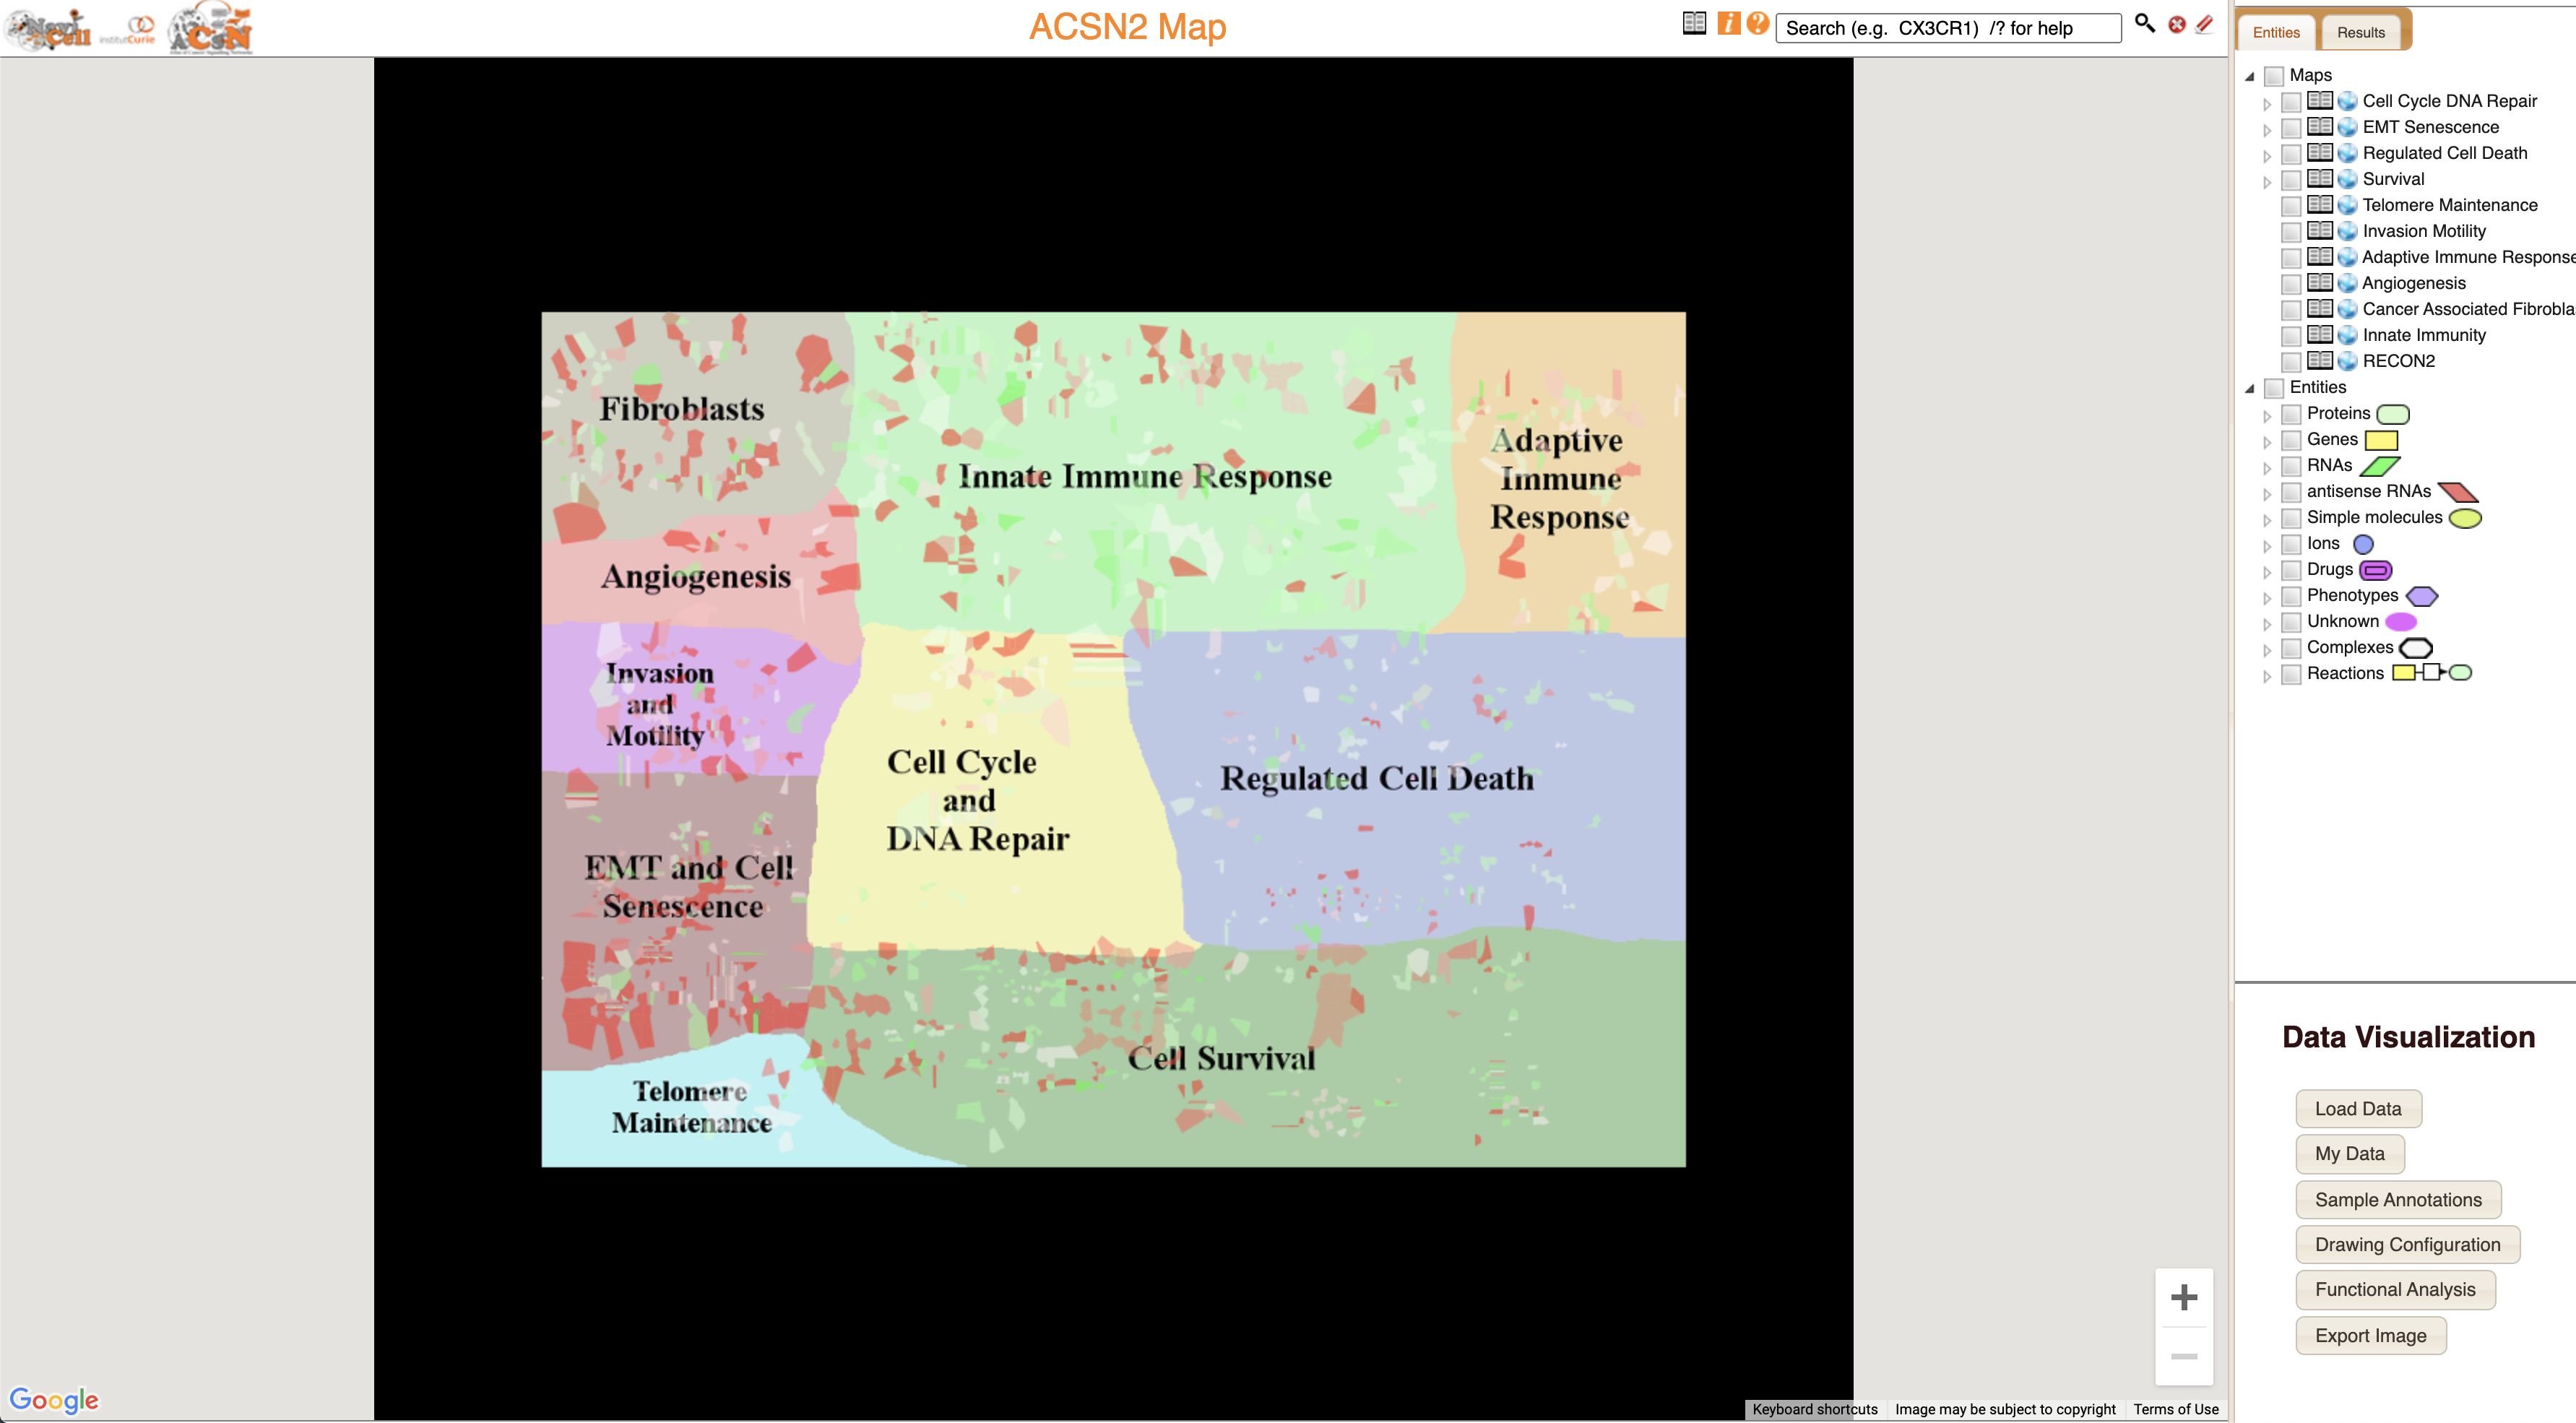
The ACSN2-Cancer Cell map represents different aspects of molecular and functional machinery of cancer progression. Let’s zoom-in to the Cell Cycle and DNA Repair area, and particularly into Cell Cycle area.
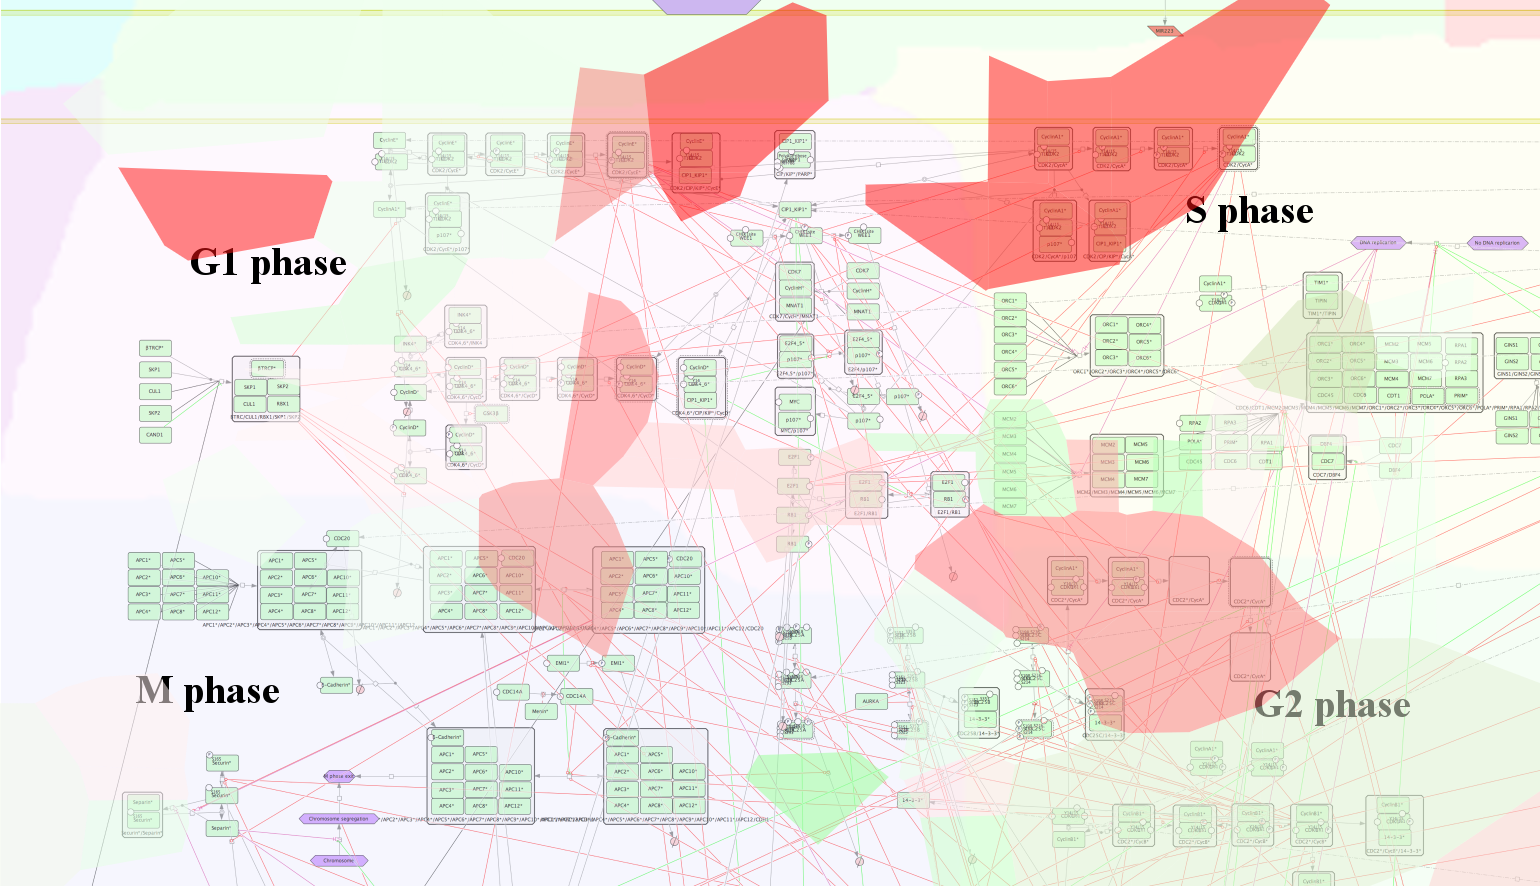
Red and green stains indicate regions of the map which correspond to specific top-ranked genes of the studied independent component (positive and negative weights). The color corresponds to the weight value: red is positive and green is negative. Right now the staining is based on the values from the IC1. This could be changed later.
Visualizing independent components using Glyphs
-
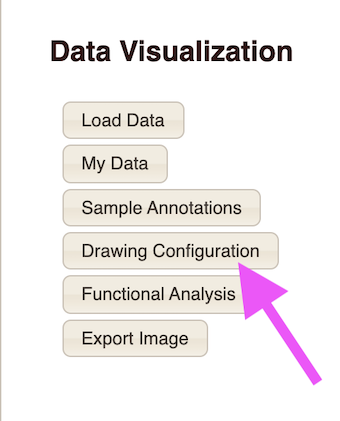
In the right bottom corner of the NaviCell window you can find a ‘Data Visualization’ section. Press on ‘Drawing Configuration’.
-
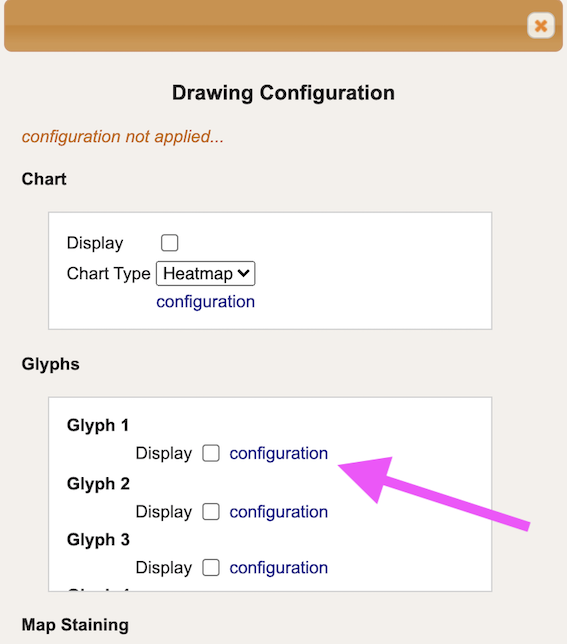
In the section ‘Glyphs’ and under ‘Glyph 1’ press on ‘configuration’ button.
-
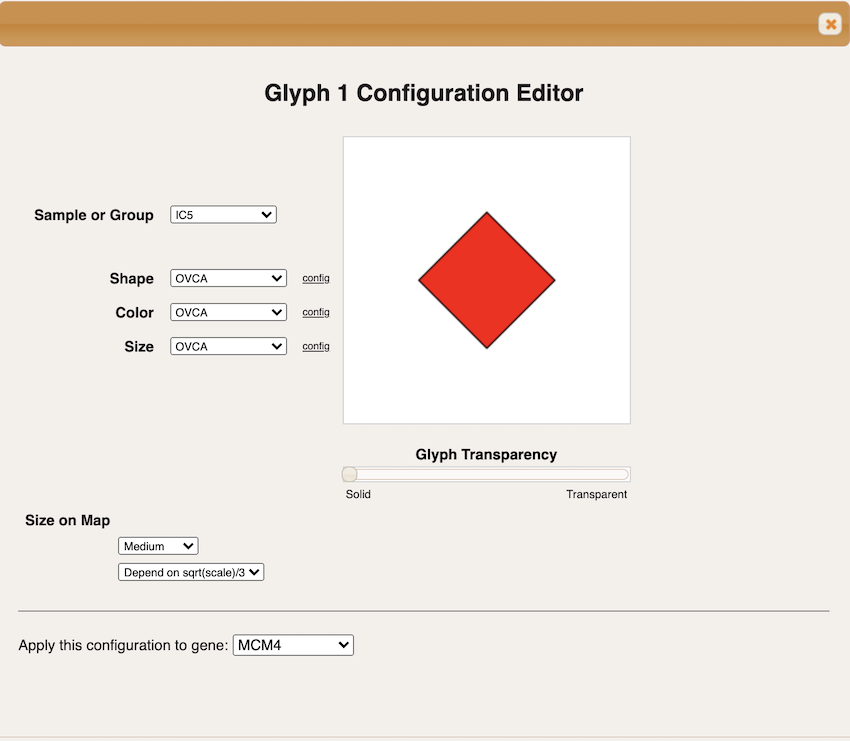
Select the independent component you want to visualize. For this tutorial we will select IC5 in the section ‘Sample Group’. This independent component was shown in previous examples as the one receiving enrichment for cell cycle genes. For parameters ‘Shape’, ‘Color’ and ‘Size’ select OVCA.
-
Press ‘OK’ to close the Glyph 1 configuration window. The Glyph 1 now should have a ‘Display’ check mark. Press ‘OK’ to close the Drawing Configuration window.
Now our map should look like this :
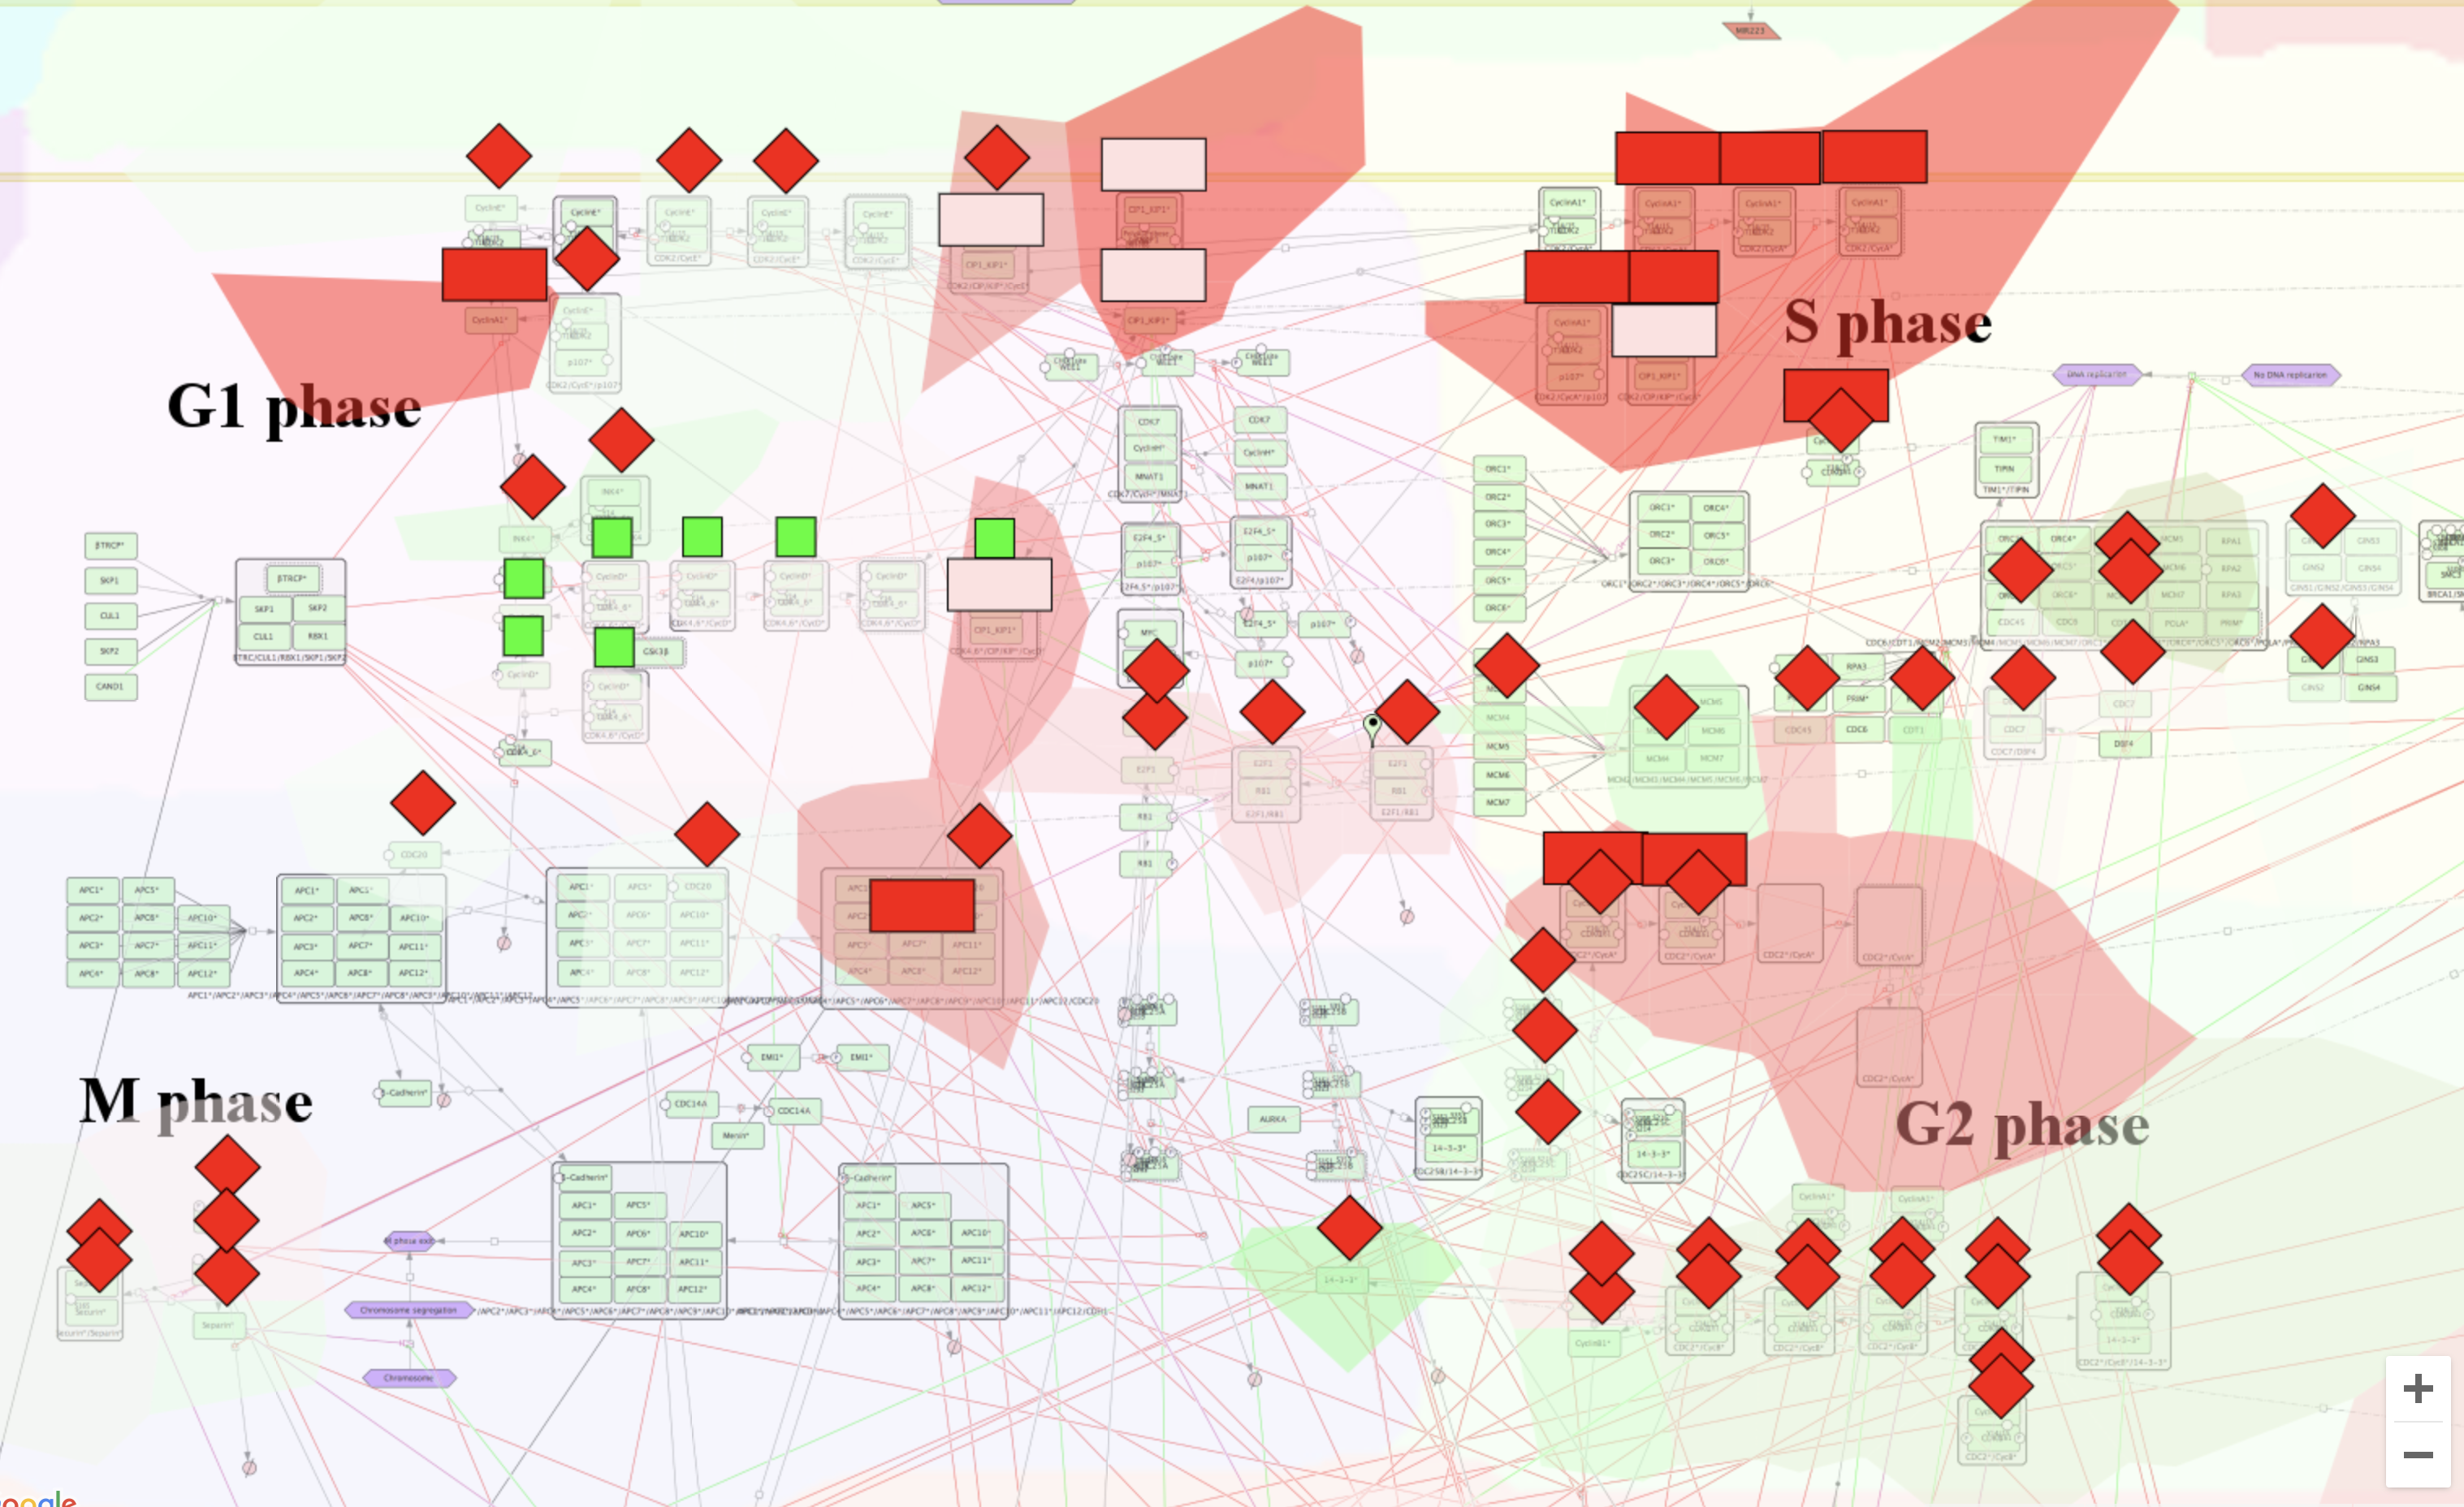
Glyphs indicate the genes of the IC5 component of the OVCA metagene, being either upregulated - red color, or down regulated - green, and the intensity of the color is proportional to the absolute value of the gene weight.
Hereby we can observe the mapping of gene weights from IC5 as Glyphs, and from IC1 as Stainings, which allow us to visually and functionally compare two independent components.
Note: In the ‘Drawing Configuration’ window the user can also change the parameters for the ‘Map Staining’ by pressing on configuration button.
Nodes
Finally, the user can look at each node of interest by directly clicking on it.
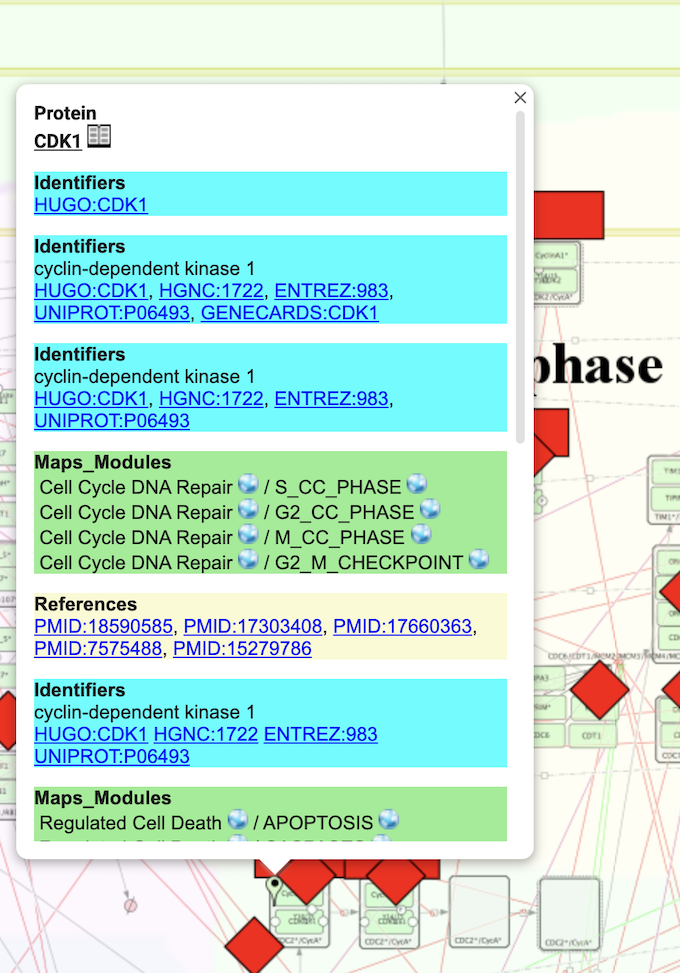
This provides direct links to gene and reference databases. By clicking on the ‘book sign’ near the name of the protein you will obtain a more comprehensive report.
Additionally you can search for the protein of interest in the search bar on top of the NaviCell window. You can access the Map legends by pressing on the small icon indicated with a magenta arrow.

Further steps
For more comprehensive tutorials on how to use all the features of NaviCell please follow the official User Guide.
Additional tutorials on getting started with NaviCell, building maps and sessions are also available here.